


Talking Points:
*EURJPY Had Its Biggest Daily Volume of 2015
*Technical Indicators flashing Bullish Bounces
*Sentiment Shows only 37% of traders are long
Much like the S&P 500, the Japanese Yen has failed to break out on risk off sentiment. A breakout in the Japanese Yen is seen by yen crosses dropping precipitously across the board. Instead, we’ve seen sideways moves in the main Japanese Yen cross of USDJPY. Without a clear direction of the yen, the yen cross is often determined by the base currency like we saw with EURJPY earlier this year where Euro was dropping across the board and JPY was basically flat bringing EURJPY down.
When looking at EURJPY today, without a yen breaking out higher, the focus remains on the EUR in light of the recent fundamental shortcomings from Greece. Surprisingly, with all the bad news and disheartening details, the euro has held up rather well bouncing higher from recent declines while the German Bund remains offered.
The backdrop of an unwillingness for the EUR to drop significantly like it did in the beginning of the year has its own message. Back then, the European Central Bank quantitative easing program was approaching but now it has been launched and a lot of the worst has been priced in already. At the same time, we’re in an environment where the JPY seems to refuse to move consistently higher. This dynamic keeps our focus that a significant pivot in EURJPY happened in April and could continue to move higher should the dynamic hold. Backing that idea is volume, sentiment, and chart patterns that we will be taking a look at in this article.
If you are unfamiliar with sentiment and volume here is a quick explanation on how this article will look at these circumstances pair moving forward.
Retail Sentiment is acquired using DailyFX Plus’ Speculative Sentiment Index. It is free for real FXCM account holders, but is also free for anyone using a two week trial: DailyFX Plus Trial. Most often, SSI will help you see the beginning of a new trend, which is historically fought by the retail trading crowd.
Retail Volume is available on FXCM’s Trading Station Desktop platform. This free software can be downloaded here and a free demo login can be acquired here. Real Volume is a default indicator that can be added to your charts. Volume is used by Institutional FX traders as well as traders from other markets to understand market participation in a move.
Potential Long-Term Turning Point in Euro Yen Off 38.2% Fibonacci Retracement
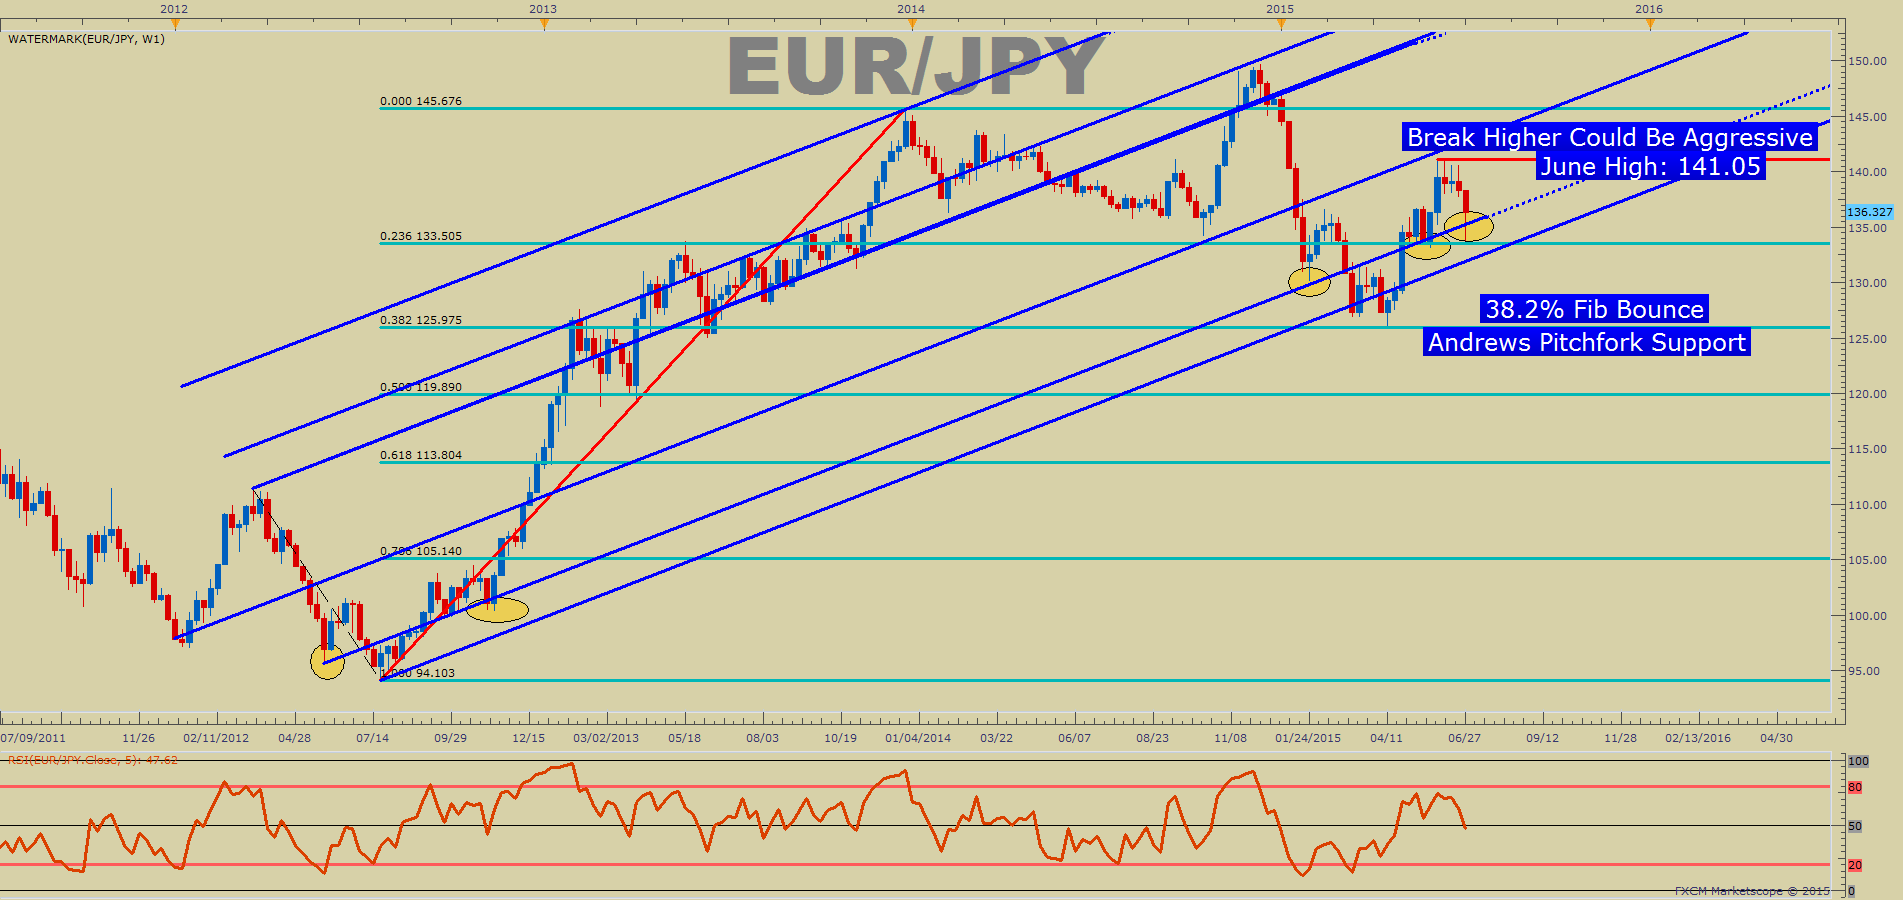
(Created using Marketscope 2.0 charts)
The chart above shows a strong move higher from 94.10 back in 2011 to an impulsive peak of 145 back in mid-2013. A pitchfork channel is also drawn from key pivots back in 2011 and you can see how the price has moved within these channel lines throughout the multiyear uptrend. Because trend continuation is preferred over a market reversal and euro yen has bounced higher often internal trend line (trend bounces highlighted in yellow) we will look for a break of the June 2015 high of 141.05 to validate further upside is potentially approaching and bringing opportunity.
Volume and Chart Indicators Favor Upside Risk

(Created using Marketscope 2.0 charts)
A few tools have been added on this shorter-term chart of EURJPY. In addition to the pitchfork (blue lines drawn from key pivots in March and April), EURJPY appears to be slowing down its dissent. This view is backed by volume, sentiment, and the Relative Strength Index Oscillator.
The RSI is showing an oversold reading on the daily charts which over the last three months has also presented nice bullish bounces. Adding to the RSI, channel support continues to hold and price has seemed to slow down near prior support in the 133/134 zone.
Ichimoku Cloud Also Shows Support at Cloud of Monday’s Low

(Created using Marketscope 2.0 charts)
Largest Volume Day in 2015 after Gapping Down On Open
On the daily chart above, you’ll notice the blue vertical bars indicating volume showed the largest reading of the year on a very bullish day. Volume does a great job of speaking to the force and enthusiasm behind a move. The fact that year to date, Monday’s (June 29, 2015) showed a large gap lower on the open, yet close near the top of the 436 daily pip range on such volume indicates there is not enough force in the market to move euro yen much lower. From a risk-management point of view, we can use Monday’s low of 133.75 as an invalidation point of further upside.
In gap analysis, when the gap is be filled, the bearish sentiment mainly washed away on a price close above the Friday (June 26) close of 138.30. A closing of that gap would further discourage bears because the 323 PIP gap down on the open was not able to hold yet alone build momentum.
Adding Sentiment to the EURJPY Picture

(Screen capture from DailyFXPlus.com)
The screenshot above of the speculative sentiment Index or SSI shows an overlay of retail open position exposure relative to price, which is displayed via a black line. You’ll notice that the market tended to be short on some of the more aggressive run ups. Currently markets are near their most net short level since the late 2013 move higher. Should the pattern continue of retail traders fighting strong trends, EURJPY should continue to move higher.
Daily and Weekly Changes in Positioning
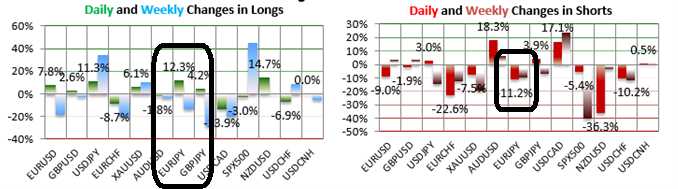
(Screen capture from DailyFXPlus.com)
Monday’s open appears to have scared many traders out of their long positions. Long positions are 13.8% below levels seen last week, and short positions are 11.2% lower than yesterday and 9.9% below levels seen last week. DailyFX uses our SSI as a contrarian indicator to price action, and the fact that the majority of traders are short gives signal that the EURJPY may continue higher. While the trading crowd has grown less net-short from yesterday, the overall sentiment is still at negative extremes.
Potential Trading Plan
Multiple indicators show EURJPY may soon bounce higher. The indicators are also backed by sentiment and the largest volume to date for the year on a bullish day.
Validation Level: Close > 138.30
Stop: 135.75
Target 1: 141.04 (June High)
Target 2: Open with Trailing Stop
Alternative Scenario: If the June 29th low of EURJPY is taken out, watch for a repeat of the April low near 126. A major risk-off scenario would further drop this target towards lower 120s.
Prior Articles:
Chart Patterns & Sentiment Alignment on EURUSD
USDOLLAR Retail Fever Aligns with ST Technical Warnings [Video]
How Using FX Sentiment Can Boost Your Trend Trading Strategy
EURGBP Double Bottom View Backed by FX Sentiment & Volume Analysis
USDCAD Symmetry Backed by FX Sentiment & Volume Analysis
Using FX Sentiment & Volume Analysis to Spot USDJPY Trend Resumption
EURJPY New Trend - FX Sentiment & Volume Analysis
---Written by Tyler Yell, Trading Instructor
To contact Tyler, email tyell@dailyfx.com
To be added to Tyler's e-mail distribution list, please click here
Tyler is available on Twitter @ ForexYell
Video Lessons || Free Forex Training
Trading Using Fibonacci (13:08)
Trading With Moving Averages (14:25)
Reading the RSI, Relative Strength Index (13:57)
Money Management Principles (31:44)
Trade Like a Professional Workshop (1:44:14)


