


Talking Points:
- Price Action can offer traders a ‘clean’ technical picture of a market; no indicators required.
- This can greatly assist those looking to avoid The Number One Mistake Forex Traders Make.
- While no system or trader can perfectly predict future price movements, risk management and price action can offer traders a way to take a consistent approach into markets.
Price Action is a study of technical analysis that can bring quite a bit of benefit to the trader. By focusing on price and price alone, investigating previous movements and how markets have reacted – traders can look to get the cleanest technical picture of a given market that might be available.
While future price movements are always going to be unpredictable, regardless of the technical method used – Price Action can highlight potential areas of interest in which traders might be able to look to risk a little bit to make more (if they’re right). This brings up the concept of risk-reward, which can be a major undoing for many traders, especially new ones.
We encountered this topic in the DailyFX Traits of Successful Traders research series. In the research study, The Number One Mistake that Forex Traders Make is faulty risk-reward ratios. Meaning that these traders lose far more when they’re wrong than they might make when they’re right. And this can be so pronounced that, in some situations such as GBPJPY, traders were winning nearly 2 out of 3 times but were STILL losing money because they’ve lost so much more in their losses than they were able to make when they were right.
Price Action can be that tool that helps traders look for advantageous risk-reward ratios. If you’re not familiar with price action and would like to establish a foundation of this type of analysis, we have a course that’s available to any trader that might be interested. The link below will take you directly to the course, and after inputting name and email address the lesson will begin.
The Price Action Primer (via Brainshark)
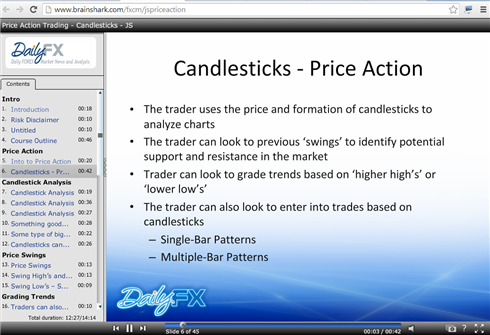
The Price Action Primer via Brainshark
In this article, we’re going to look at three of the basic rules that traders can look to build their approaches and strategies around.
The trend is your friend – but the trend is also relative
Most traders know they should look to trade in the direction of the trend. And the reason for this goes right back to the unpredictable quality of markets: As in, I may not be able to predict what will happen next, but if the bias I’ve seen here (trend) can continue, then I can find myself in a pretty good spot by trading in that direction.
Sometimes trends continue, sometimes they don’t… and that’s where risk management comes in: So that when trends don’t continue, the trader can look to mitigate the loss but if the trend does continue, they can look to make more than they had to risk to get in the trade.
But which direction is the trend going, and how should we analyze them?
One of the best parts about price action is that it offers a formulaic way of identifying trends: And that formula is that up-trends will often show series of ‘higher-highs’ and ‘higher-lows,’ while down-trends will often show ‘lower-lows’ and ‘lower-highs.’ Think of this like a ‘two-steps forward, one step back’ type of gyration.
Price Action highlights trends
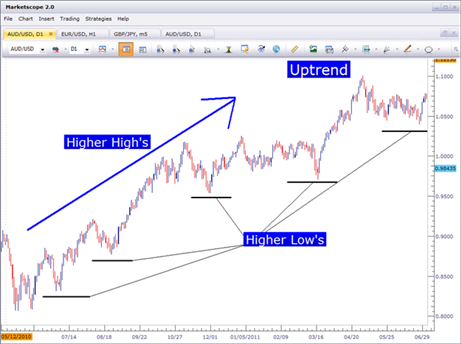
Image taken from Price Action, an Introduction by James Stanley
The one-hour chart of a given market may be showing an up-trend, but if the daily chart is showing a down-trend – which is right? And further, which should the trader look to work with?
There is no ‘right’ answer to this question just like future price movements are unpredictable; and this highlights the importance of a written trading plan or, at the very least, a consistent strategy for analyzing markets. Traders need to choose the time frame(s) with which they want to work so that they can consistently identify opportunities on a day-in, day-out basis.
Further to this point – traders should choose to analyze chart time frames that fit their desired holding periods. As in, if one is looking to scalp on the one-minute chart, analyzing trends on the daily or weekly charts may be so disconnected from near-term price action that the trend analysis isn’t offering the trader much advantage.
Traders can still use multiple time frame analysis in the effort of getting the ‘most clean’ picture of a market, but the time frame utilized for trend analysis should remain the same to help the trader approach a market with a degree of uniformity.
The table below, taken from the article The Time Frames of Trading, suggests potential time frames for traders to investigate based on their style or approach. For each approach, there are two different types of time frames offered in each column. The column to the right of the table for ‘entry chart’ suggests the time frame that the trader can look to for the actual entry into the position (which we discuss further in the below sections). The column to the left of that for ‘trend’ chart suggests a time frame with which traders can look for ‘higher-highs’ and ‘higher-lows’ to signify an up-trend.
Potential Time Frames given ‘style’ and desired holding periods

Image taken from The Time Frames of Trading, by James Stanley
And if an up-trend is showing in the market, the trader wants to look to ‘buy low,’ and this can be done after a new ‘higher-low’ is set. The trader can look at the entry chart to confirm the higher-low, and to line up the risk management (stop placement) of the position.
If you’d like more information on time frames or even just the premise of Multiple Time Frame Analysis, the article The Time Frames of Trading discusses these topics at length.
And if you’d like more information on trading trends using multiple time frame analysis combined with price action, we discuss that in the article How to Attack Trends Using Price Action.
Wicks highlight reactions – and reactions can be opportunities
One of the greatest parts about trading with candlestick charts are the potential ‘tells’ that might be offered. As in, if resistance is coming in a market we’ll generally see sellers coming in to offset buying interest. And this can show up on a chart before the actual move or swing materializes as that buying pressure (of those attempting to chase the previous up-trend) and selling pressure roughly offset.
When sellers come into a market to take advantage of new higher prices, a wick on the top-side of price action can show up… or on the other side, if buyers are coming in to a market to take advantage of new, lower prices wicks can show up on the bottom-side of price action.
This can be valuable because it’s the earliest sign of a potential reversal or swing in the market. Buyers taking control mean higher prices, and that wick highlights a potential area of support. We discuss this premise in much more detail in the article, The Power of Wicks in the Forex Market.
Traders can look for wicks to highlight the end of retracements (and trend opportunities)
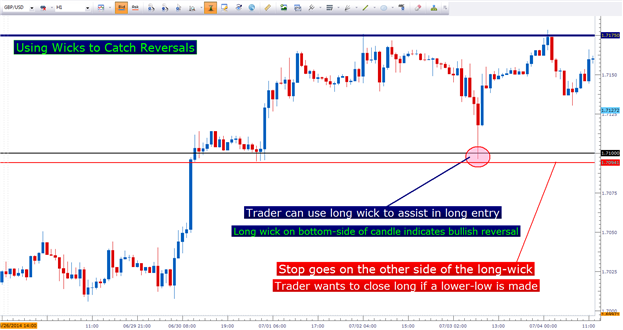
Image taken from The Power of Wicks in the Forex Market, by James Stanley
In the article, we also explain how wicks can highlight support or resistance levels that the market may deem important. After all, if buyers are going to jump into a market that’s seen near-term weakness, there is a reason for it, right?
Maybe that reason is a news report or a really large order from a bank or market maker; or perhaps it was just a really long-term level that helped to change the near-term trend in that market.
But where this comes in as relevant is that entry chart we had alluded to earlier… If a trader identifies an up-trend, their objective should then be to buy as cheaply as possible so that if the trend doesn’t continue, the loss can be mitigated.
After a trader has observed an up-trend on the longer-term chart, they can begin looking for buy opportunities on the entry chart. And once again, as discussed in the previous section traders should look to ‘buy low,’ meaning after a recent retracement or pause in the trend.
By looking for wicks on the bottom of price action on the ‘entry’ time frame, traders can look for areas where buyers are coming into the market to take advantage of new, lower prices. And this can offer an area where traders can look to go long with a stop below the wicks (support). That way, if the trend doesn’t come back on the shorter-term chart, the trade can be cut as the trader looks to mitigate their loss.
But – if that bias that’s been seen on the bigger picture chart does come back in the market, the trader can find themselves in a handsome position as the market moves in the direction of their trade.
Once again, this isn’t built to be a perfect system because that doesn’t exist. But by using multiple time frames with a ‘clean’ system of analyzing technical situations on charts, traders can attempt to focus on the most probabilistic scenarios based on how they want to approach a market.
Risk Management is built-in with Price Action
The last rule is, in my opinion, the best one. And that’s the fact that the aforementioned basic price action rules offer a rather simple way of looking to manage risk.
If a trader sees an up-trend on the longer-term chart, and wants to buy – what business does that trader have of staying in the long position should the market go on to make lower-lows and lower-highs?
After all, this is indicative of a down-trend; and if the trader is in a buy position when a down-trend starts or picks up, why would they want to sit in the trade and watch equity evaporate from their account?
They shouldn’t – this is exactly how traders fall prey to that Number One Mistake FX Traders Make.
Things change, markets are dynamic, and prices are unpredictable: You’ll never be able to build a strategy with a 100% success rate because perfection in trading is, unfortunately, impossible.
But this built-in risk management doesn’t end with trends; traders can apply a similar type of approach to trading range-bound markets with price action, as we had discussed in the article How to Analyze and Trade Ranges with Price Action.
Putting it all together
While price action may not be a panacea, it does offer traders a clean way of analyzing technical setups on the chart so that they can look for strong risk-reward ratios.
Traders can use trends on longer-term charts to expose biases in the markets. And if looking to buy, traders can wait for a ‘higher-low’ to be made, and then can investigate entry on the shorter-term chart. As the shorter-term chart begins to show ‘higher-highs’ and ‘higher-lows’ as evidenced with wicks on the bottom-side of price action; the trader can enter under the presumption that the trend may be coming back.
There is no need to predict, nor should traders expect the powers of prediction to bring them much long-term benefit in the field of trading.
If the trend doesn’t come back, then bail for the smallest loss possible by using that support (and wicks) for stop placement…. And if the trend does come back, the trader gets to manage a winning position.
--- Written by James Stanley
Before employing any of the mentioned methods, traders should first test on a demo account. The demo account is free; features live prices, and can be a phenomenal testing ground for new strategies and methods. Click here to sign up for a free demo account through FXCM.
James is available on Twitter @JStanleyFX
Are you looking to take your trading to the next level? The DailyFX 360° Course offers a full curriculum, along with private, weekly webinars in which we walk traders through dynamic market conditions using the education taught in the course.
If you’d like a customized curriculum based on your current experience level, our Trader IQ course via Brainshark can offer assistance. Please click on the link below to complete our Trader IQ questionnaire.
Would you like to trade alongside seasoned professionals throughout the trading day? DailyFX On Demand gives you access to DailyFX Analysts during the most active periods of the trading day.
Would you like to enhance your FX Education? DailyFX has recently launched DailyFX University; which is completely free to any and all traders!


