


Talking Points
- NZDUSD has rebounded from the 50% Fibonacci retracement area at 0.8083
- NZDUSD has also broken a downtrend line on the daily chart time frame.
- The 61.8% Fibonacci expansion target is a conservative profit taking level.
Though recent economic data out of China’s service sector showed slumping activity, the NZDUSD maintains the 0.8250 area. As New Zealand’s second biggest export partner, China's economic data, positive or negative, usually impacts New Zealand’s currency. It is usually said that if the Chinese economy catches a "cold", the New Zealand economy gets the "flu". However, the resilency of the Kiwi versus the US Dollar in the face of negative Chinese data is something Forex traders are taking notice.
Technically, NZDUSD has rebounded from the 50% Fibonacci level after declining nearly 460 pips since the 10/22 high of 0.854. After a failed attempt to rally on 12/10, NZDUSD surged into the New Year through the 0.382% Fibo to a high of 0.8316 where it sits above a daily downtrend resistance line. The combination of the higher low, outside day candlestick pattern at the 38.2% Fibo, and a trend line break are three clues that traders can look at to determine that this move has further to go.
Learn Forex: NZDUSD Fibonacci Outside Day Candlestick Bounce
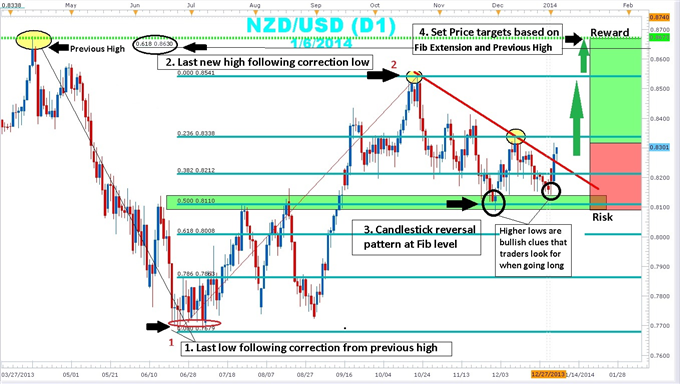
(Created Using FXCM’s Market Scope 2.0)
But how much farther could this move have before the next wave of profit taking? Fibonacci expansions can be used to forecast price targets beyond the 100% of the move. While the popular expansion targets are 127%, 161.8%, and 261.8% sometimes price has a mind of its own and turns just short of these targets. So many traders and ‘algos’ (computer trading programs), have these exit levels on their radar that price turns down before those levels are actually reached as they run to the exits. Using less common and more conservative targets may be the solution. The 0.618 expansion is half way between the 127% and the 100% levels is a good place to take full or partial profits. The remainder of the position can be left to possibly run to the more aggressive targets at the 127% and the 161.8% levels. Fibonacci forex traders will look for the 50% Fibonacci support to hold. A stop could be placed just below that level. Traders can wait for a confirmation to go long with a break above 0.8320. In addition, a limit can be placed at the 0.618 Fibonacci expansion at 0.8630.
---Written by Gregory McLeod Trading Instructor
This article showed you how to use Fibonacci to trade NZDUSD bounce. I want to invite you to enroll in our free Fibonacci Retracement Course to further your understanding of Fibonacci. Sign our Guestbook to gain access to this course that will help you get up to speed on Forex market basics. Register HERE to start your Forex learning now!


