


- Forex Chart patterns used to analyze price charts can be used on the Relative Strength Index (RSI)
- Forex Trend line breaks of RSI can predict important turning points in a currency pair
- Forex Trend line breaks of RSI are an easy and systematic way to enter and exit the market
Traditionally, traders have relied on the Relative Strength Index (RSI) to measure the strength of a currency pair by tracking the changes in its closing price. They look to get long a currency pair as RSI moves above the horizontal 30 reference line. On the other hand, traders look to sell a currency pair after RSI moves above the horizontal 70 reference line and back below it.
Learn Forex: Traditional RSI Signals
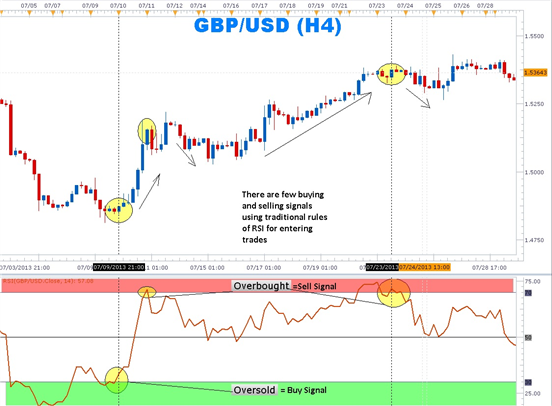
In the example above, a trader would look to enter long GBP/USD when RSI moved below the 30 horizontal reference line and then moved back above.GBPUSD moved strongly until RSI moved above 70 and fell back below generating a sell signals.
However, an overlooked method of using RSI is the use of trendlines directly on the oscillator itself in much the same way that they are used on price charts. Connecting rising swing lows in an uptrend or lower swing highs in a downtrend, traders can find excellent trading opportunities with strong risk to reward setups. Because RSI measures the surge in closing prices, when RSI changes direction and either breaks above or below a trend line, a significant move in price can result.
Learn Forex: Using RSI Trendline Breaks to Enter and Exit Trades
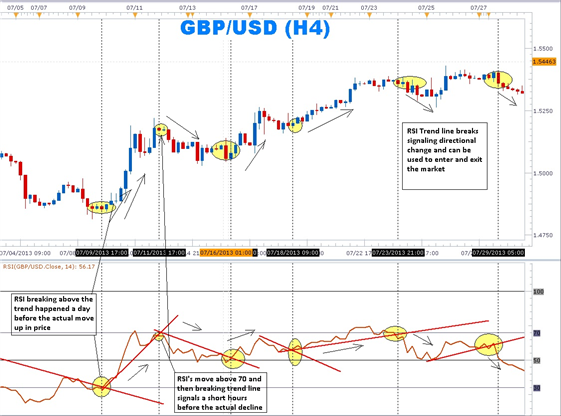
Trendlines placed on this oscillator provide an additional level of precision as well as additional trade setups. Because the signals are leading rather than lagging, stops can be placed relatively close to the entry point. This allows for a good risk to reward trading opportunity.
In the above chart of the very same GBPUSD 4-hour chart used in the previous example, trendline breaks identified several more setups. The use of the trendline provided additional visual confirmation that a trade opportunity was near. The use of trendline breaks also gave buy and sell signals a few candles before the actual move.
RSI trend lines can be used on any chart time frame from as large as monthly and weekly to as small as 15-minute and 5-minute time frames. Traders can benefit from using RSI trendline breaks in their trading to find more timely entries with better precision.
--- Written by Gregory McLeod, Trading Instructor
Interested In Our Analyst's Best Views On Major Markets? Check Out Our Free Trading Guides Here


