


Article Summary: Charts present price action to traders like you across the world. Today, most traders start with candlesticks but they are relatively new to traders in the Western Hemisphere. The other options have clear functions that may help you see the forest for the trees and trade more effectively. This article will walk you through the methods used historically and share with you why some traders prefer one chart construction over the other.
Charts are the starting point of any technical or price action based trader. A price chart is nothing more than a graphical display of price over a fixed amount of time. However, the charts help a trader ask the market about the market so that a trend is clear or trade opportunity can become clear.
History of Charting
Charts have been around since the 1700s when rice traders in Tokyo began plotting price on paper. Specifically, the look at price over a fixed period of time to find patterns that they could profit from. To their credit, Japanese Technical analysis in the form of candlesticks is still a prominent form of price action analysis today.
When technology picked up at the turn of the 20th century, the ticker tape became the mainstay of brokerages and professional traders. Because computers weren’t available then, traders would take the figures off the tape and hand draw their own charts to see when breakouts would occur or if a clear pattern was in place. The common saying was that when the tape wasn’t acting right, opportunity was ripe.
“I never argue with the tape. Getting sore at the market doesn't get you anywhere.”
-Larry Livingston (As Jesse Livermore), Reminiscences of a Stock Operator.
Today, computers allow traders to come up with any type of chart they wish in a matter of seconds. The goal of any trader on any chart is to use the chart they are comfortable with to identify a high probability opportunity. The visualization of the chart can be anything from a line, a bar, or a candlestick.
Chart Options & Their Benefits
Candlesticks
Candlesticks help traders understand the emotion behind the day’s price. The methodology for this is a unique display of the Open, High, Low, & Close. The candlestick then is made up of wicks & the real body.

Source: fxwords.com/j/japanese-candlesticks.html
The real body shows you the conviction of the move whereas the wicks show you the overextended emotion that likely won’t hold. If the real body (open to close relationship) takes up a majority of the candle, then you have a trend candle because the price closed near the periods end. If the wick (high to low relationship) takes up a majority of the candle, then you can be presented with a flashing-light so to speak of indecision which can warn you to get out of the trade if you were trading with the trend or to look and revers the move off of the emotional over-extension.
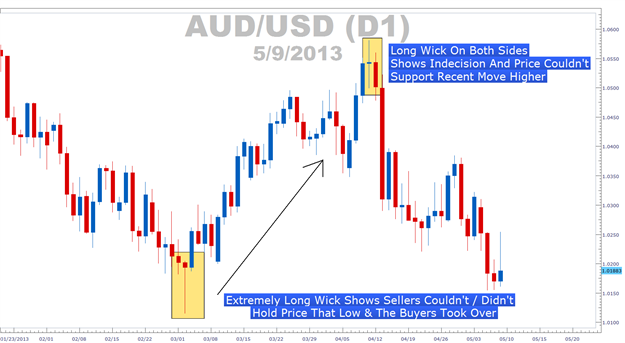
Learn Forex: AUDUSD Range Has Been Bound By Large Wicks Highlighting Entries
A Japanese Proverb that is often quoted by Candlestick charting enthusiast’s states, “Candles exhaust themselves to give light to men.” Candlestick analysis is given a seeming majority of attention in today’s market. If you’d like to know what candlestick formations are currently on the Daily Chart, our Technical Analyzer tool scans and presents trades based on those formations.
Learn Forex: Daily Candlestick Analysis Available On Technical Analyzer

(Trading Central’s Charts available on DailyFX Plus’ Technical Analyzer. Free Trial Available)
Bar Chart
While bringing you the same information as the candlestick charting technique, the bar chart has a little less flare. The Bar chart clearly displays the open and the close as well as the high and low but lacks the color. Some traders who feel the high / low information is key but doesn’t want the color coding bias stick with the bar chart to find simple patterns they can trade.
Learn Forex: Side by Side Comparison of Bar Charts (Left) & Candlestick Charts (Right)

Source: fxwords.com/j/japanese-candlesticks.html
Traders often look at bar charts to observe range comparisons. If a bar’s range is completely inside a previous bar or completely outside the previous bar then you can be at a spot of indecision that can precede big moves.
Learn Forex: Inside Bar

Line Charts
Line charts provide the least amount of data however; this isn’t necessarily a bad thing. Many traders believe the close is the most important price of the day and that is where the line chart shines. The simplicity of line charts is especially prevalent in well-defined trends.
Learn Forex: Line Charts Get Rid Of the Noise and Present You Only With Closing Data

To give some credit to this simplistic chart, Jamie Saettele, our Sr. Technical Strategist, uses lines charts often in his Elliot Wave analysis.
Closing Thoughts
You should now have a comfortable grasp on the 3 main forms of charts. More importantly, you can also see the benefits of each so that you can choose the one that is right for you. In the end, the chart that you’re comfortable managing risk on and finding high probability entries, will likely be your best fit.
Happy Trading!
---Written by Tyler Yell, Trading Instructor
To be added to Tyler’s e-mail distribution list, please click here.
Would you like dozens of trade ideas every day with updated charts to identify major levels support and resistance on the currency pair you’re trading?
If so, click here to learn more about our Technical Analyzer on DailyFX Plus.


