


Article Summary: Nothing beats price action when it comes to gauging the sentiment and momentum in the market in real time. However, indicators like Ichimoku help traders determine where is a relatively conservative place to enter once a market environment has been determined. Once traders find a great indicator that works with their personality they can fall into the trap of using one indicator on every chart even if different environments are present. This article will walk through the best times to use and not use the dynamic Ichimoku indicator.
It’s been said when you’re a hammer everything looks like a nail. That can be very tough when you’re trading a market that can have multiple environments and patterns. Because the market is rarely if ever all trending or all range bound, you need to know when to use what indicators and how. To find out when to trade trending or range-bound markets intraday, check out this free report.
Unequivocally, Ichimoku is best used in Trending markets. If you apply Ichimoku to a range bound market, you will often get a signal to enter a Buy trade as the market is about to return to the bottom of the range or vice versa. Trying to force a trend out of a clear range is extremely frustrating and is also a sure fire way to drain your trading capital.
Learn Forex: Trading a Range with Ichimoku Isn’t Worth Your Time
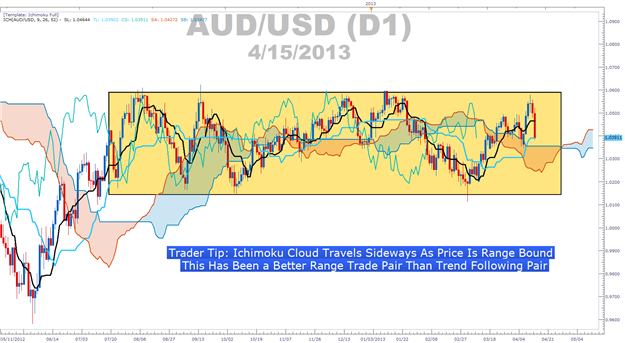
Last week marked the 5th time we’ve come to the top of the AUDUSD range near 1.06 since August 2012. As you can imagine, Ichimoku can be very helpful when there are higher highs and higher lows clearly laying out an uptrend. Reversely, when you have a rather tight range, the 9 & 26 period average or trigger and base line get you into a trade at the least advantageous point.
The take away is to make sure that you’re only trading Ichimoku when a trend is present. There are a few ways to recognize a clear trend and with Ichimoku you can simply look for a rising or falling cloud. If the cloud is not higher or lower than in previous months then it’s best to stay away from Ichimoku to identify a good trade.
Are There Any Markets That Are Not Optimized For Ichimoku?
Every Thursday morning, I do a live webinar walking traders through Ichimoku (Email me if you’d like access). One question that commonly comes up is if Ichimoku only works for FX. The answer is unequivocally no.
Ichimoku works on any tradable market in any time frame. Whether, you’re looking at commodities, stocks, futures, or FX you can trade effectively in the direction of the trend with Ichimoku. Here is how XAUUSD / Gold Traders have stayed on the right side of the trend with Ichimoku.
Learn Forex: Ichimoku helped XAUUSD Traders Stick with the Trend

Speaking of the current chaotic drop in Gold, it is the biggest two-day drop in 30 years. What’s more is that the last two times a drop of similar significance took place in the yellow precious metal was the summer of 2008, before the global credit crisis kicked off before Lehman. The other time was in the fall of 2011 just as Europe because the crisis du jour.
Past events / reactions do not always predict the future but if a massive windfall or selling of this stature is taking place for a reason, watch out. Watch out for a major unwinding of a popular trade like the JPY sell off or something of similar scale. It’s times like this when proper trade size will help you from stepping into a market trap.
Ichimoku Trade: Buy USDCAD as Some Rules Below Are Aligned While CAD Continues To Weaken

Ichimoku Trade: Buy USDCAD
Stop: 1.0075 (Below Major Support of Cloud & Recent Price Pivot)
Limit: 1.0475 (1: 1.66 Risk: Reward Ratio in Direction of Trend)
If this is your first reading of the Ichimoku report, here is a recap of the rules for a buy trade:
-Price is above the Kumo Cloud
-The trigger line (black) is above the base line (light blue) or is crossing above.
This hasn’t happened yet. If you’d like to be more conservative, you can wait for this important signal. The thrust of the move crossing above the base line is what encouraged this trade.
-Lagging line is above price action from 26 periods ago.
This also hasn’t happened yet. If you’d like to be more conservative, you can wait for this important signal.
-Kumo ahead of price is bullish and rising.
-Entry price is not more than 300 pips away from base line as it will likely whip back to the line if we enter on an extended move.
When employing Ichimoku to spot good entries in the direction of a strong trend, price action bounces off the bottom of the cloud can provide great entries which we see forming with USDCAD. Also, you can see this trend, while slower in formation than other trades, has been definitively up since summer 2012. If price remains above the cloud but moves below the base line (light blue) then you should keep your eye out for price crossing back above the base line on rising strength. A Base Line crossover is often a great indication that the trend is back in full swing.
Happy Trading!
---Written by Tyler Yell, Trading Instructor
To be added to Tyler’s e-mail distribution list, please click here.
Take this free 20 minute “Price Action - Candlesticks” course presented by DailyFX Education. In the course, you will learn about the basics of price action and how to use the clues the market is providing to place trades.
Register HERE to start your FOREX learning now!


