


Talking Points:
- Gold Prices Prepare For Markets Next Breakout
- Key Support is Found at $1,245.38
- Looking for additional trade ideas for Gold and the US Dollar? Read Our Market Forecast
Gold prices are preparing for the markets next breakout, trading just off of yearly highs at $1,260.23 ahead of this morning’s news. There is a slew of high importance data to be released this week. This includes this morning’s US Durable Goods Orders (JAN P). Expectations for the event are set at +1.9%, and depending on the outcome may directly influence USD priced assets such as gold.
Technically, gold prices may be interpreted as bullish in the short term. Currently prices are trading at $1,255.37, which is well above the 10 day EMA (exponential moving average) which is found at $1,245.38. This line is currently acting as a point of support for the commodity, and if prices remain supported it is likely that the current bull trend may continue. Alternatively if prices begin to decline on this morning’s news, a breakout below $1,245.38 would signal a shift in the markets short term momentum. In this scenario, traders may look for gold prices to challenge last week’s low found at $1,226.23.
Gold, Daily Trend with Averages
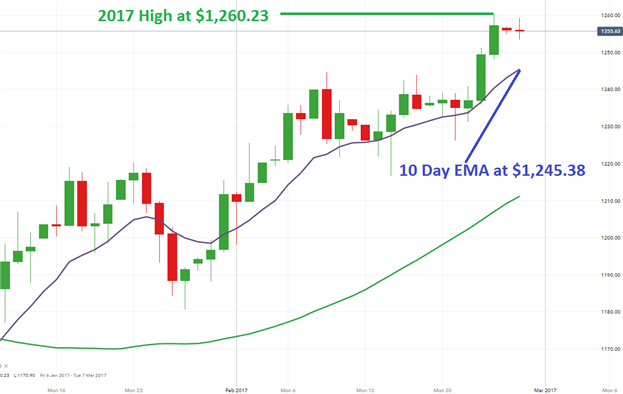
(Created Using IG Charts)
Traders tracking the US Dollar Basket should note that the Index has flat lined after putting in a high last week at 101.65. While prices are arguably trending higher, with the US Dollar above the 10 day EMA found at 100.98, traders may note that the US Dollar is trading in a broader consolidating pattern. As seen below, the US Dollar has been trading in a developing triangle after printing a series of lower highs and higher lows.
If the US Dollar begins to weaken, traders will first look for the Index to decline below the displayed 10 Day EMA. This move may then be followed by a larger breakout under triangle support found near 100.77. In this US Dollar bearish scenario, it would be reasonable to expect gold prices to rally. Alternatively if the US Dollar rallies above the descending line of triangle resistance, it would be likely to see gold decline back under its previously mentioned 10 day EMA.
US Dollar Basket, with Triangle

(Created Using IG Charts)
--- Written by Walker, Analyst for DailyFX.com
To Receive Walkers’ analysis directly via email, please SIGN UP HERE
See Walker’s most recent articles at his Bio Page.
Contact and Follow Walker on Twitter @WEnglandFX.


