


Talking Points:
- Gold Prices Fail to Progress in Uptrend
- Daily Support Found at $1,232.42
- Looking for additional trade ideas for Gold and Commodities Markets? Read Our Market Forecast
Gold prices are consolidating to start the week, and have failed to put in a daily high since February 8th. In the absence of a new high above $1,244.71, Gold’s 2017 uptrend remains in jeopardy. Technically the commodity remains supported in the short term above its 10 Day EMA (exponential moving average) at $1,232.42. If the commodity closes below this point, it may signal a bearish shift in the market for the first time in February’s trading. Traders should note that a bearish move would also place gold prices back in the direction of its longer term downtrend. The commodity has remained below its 200 day MVA (simple moving average) since November of 2016.
Gold, Daily Chart with Averages
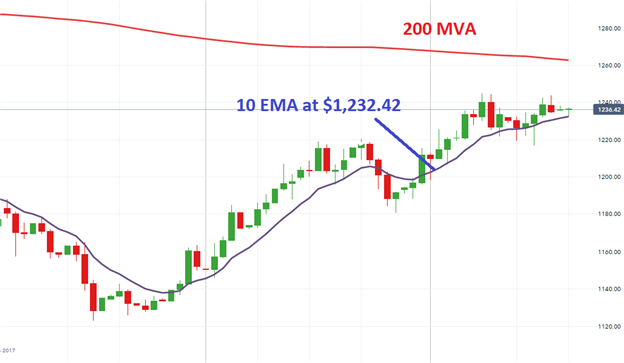
(Created Using IG Charts)
Intraday market analysis has the price of gold trading near today’s central pivot at $1,236.64. If gold prices are to resume trending higher, the commodity must first trade through today’s R1 and R2 pivot, found at $1,237.91 and $1,239.56. A move to this point would expose a breakout above the R3 pivot at $1,240.85. A move above this value should be seen as significant, as gold’s next point of significant resistance would be the previously mentioned 2017 high at $1,244.71.
In the event of a bearish reversal, initial values of support may be found at the R1 and R2 pivots found at, $1,235.02 and $1,233.33. So far prices have tested support at R2 twice in today’s trading, but have failed to make significant progress below this point. If prices begin to turn lower, today’s last value of intraday support may be found at $1,232.11. A breakout below this point would place gold prices back below the previously mentioned EMA, and open the commodity to trade towards new lower lows in the short term.
Gold Price 30 Minute Chart & Pivots

(Created Using IG Charts)
--- Written by Walker, Analyst for DailyFX.com
To Receive Walkers’ analysis directly via email, please SIGN UP HERE
See Walker’s most recent articles at his Bio Page.
Contact and Follow Walker on Twitter @WEnglandFX.


