


Talking Points:
- Gold Prices Slide as US Dollar Firms
- Daily Support for Gold is Found at $1,225.61
- Looking for additional trade ideas for Gold & the US Dollar? Read Our Market Forecast
Gold prices are retreating to begin this week’s trading, as the US Dollar gains strength in the short term. Technically, gold prices are continuing to trade lower after putting in a new 2017 high at $1,244.71 last week. Despite this decline, the short term trend for gold may still be interpreted as bullish. As depicted below, gold prices remain supported by a rising 10 day EMA (exponential moving average) which is found at $1,225.61. If prices bounce here, traders may look for a resumption of this ongoing bullish trend. However in the event of a breakout below $1,225.61, the trend in gold may then be interpreted as bearish for this week’s trading.
Gold Price, Daily Trend with Averages
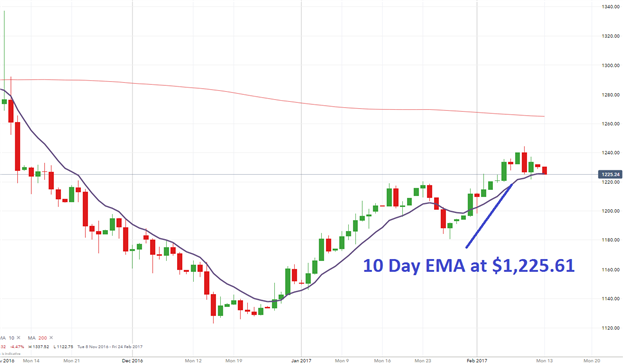
(Created Using IG Charts)
Traders tracking the US Dollar Basket should note that the Index is currently trending higher in the short term. Currently, prices are trading directly below last week’s high of 100.96. If prices breakout above this point, the US Dollar may next attempt to rally towards the January 19th swing high found at 101.67. In this scenario, if the US Dollar continues to appreciate, traders may look for the price of gold to continue to decline.
Alternatively, in the event that the US Dollar begins to weaken, traders should look for the Index to decline below today’s 10 day EMA at 100.45. A move below this value would suggest a shift in momentum for the US Dollar and open up the Index to then retest yearly lows at 99.15. In this bearish US Dollar scenario, traders may reasonably expect gold prices to rally and once again trade above the previously mentioned 10 day EMA at $1,255.61.
US Dollar Basket, with Averages

(Created Using IG Charts
--- Written by Walker, Analyst for DailyFX.com
To Receive Walkers’ analysis directly via email, please SIGN UP HERE
See Walker’s most recent articles at his Bio Page.
Contact and Follow Walker on Twitter @WEnglandFX.


