


Talking Points:
- Crude oil prices rebound from weekly lows
- Intraday resistance is found near $53.40
- Looking for additional trade ideas for Oil and Commodities Markets? Read Our 2017 Market Forecast
Crude oil prices are recovering, after initially trading to new monthly lows earlier in the week. Despite this bounce, crude oil could still be classified in a developing short term downtrend, with prices trading below the displayed 10 day EMA (Exponential Moving Average) found at $53.31. $53.31 should now be considered a key point of resistance, and if crude oil fails to breakout here the commodity may continue to trade lower in the short term. In a continued bearish scenario traders may next look for crude to test values of daily support. This includes the weekly swing low at $51.66 and the January 10th low at $51.34.
Crude Oil Daily & Averages
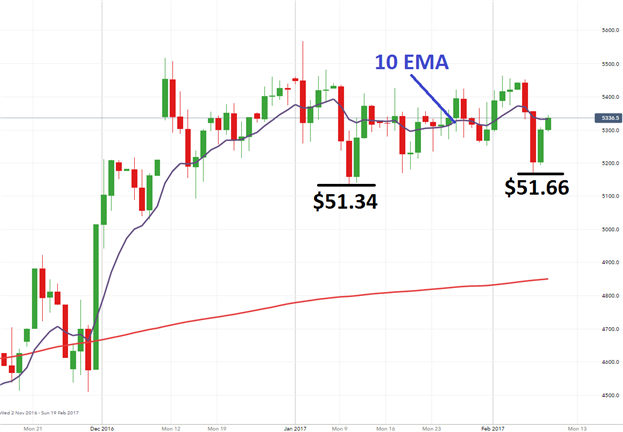
(Created Using IG Charts)
Intraday, crude oil is also testing another point of resistance. Today’s R1 pivot is found at $53.40, and so far for today’s session price has been rejected here. If prices do breakout higher in the short term, the next line of resistance is found at $53.81. A move here should be seen as significant as it would place crude oil prices back above the previously mentioned 10 day EMA. It should be mentioned here that the final value of intraday resistance is found at today’s R3 pivot at a price of $54.54.
In the even that crude oil prices fail to breakout higher, traders may look for a shift in momentum below today’s central pivot at $52.67. A move here would suggest a return to bearish market conditions in the short term, and expose key intraday values of support. This includes the S1 and S3 pivots found at $52.27 and $51.54 respectively.
Crude Oil 30 Minute Chart with Pivots

(Created Using IG Charts)
--- Written by Walker, Analyst for DailyFX.com
To Receive Walkers’ analysis directly via email, please SIGN UP HERE
See Walker’s most recent articles at his Bio Page.
Contact and Follow Walker on Twitter @WEnglandFX.


