


Talking Points:
- Gold Prices Rise to New Highs to Start Trading Week
- Daily Support is Found at $1,220.00
- Looking for additional trade ideas for Gold & Commodities? Read Our Market Forecast
Gold prices are rising higher to start this week’s trading, and are now trading off of a new 2017 high at $1227.06. Technically, this new high is significant as gold prices are now set to close above a previous point of resistance at $1,220.00. In the short term, this uptrend is supported by a rising 10 day EMA (exponential moving average) which is found at $1,213.00. If prices continue to rise throughout the week, traders will next look for gold prices to challenge the daily 200 day MVA (simple moving average) which is found at $1,266.38.
Gold Price, Daily Trend with Averages
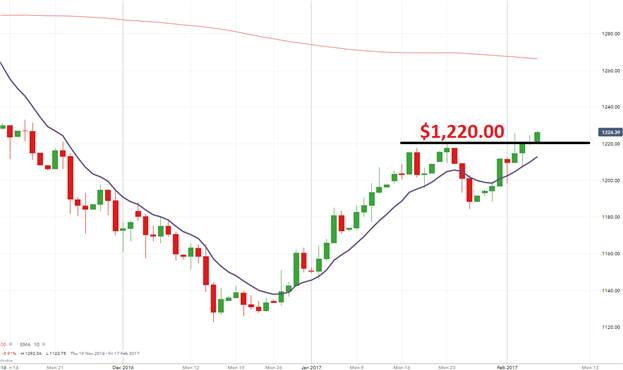
(Created Using IG Charts)
Intraday analysis has gold prices testing resistance found at today’s R2 pivot found at $1,227.28. If prices continue to rise, traders may find next resistance at the R3 pivot at $1,229.73. However if prices turn at present values, gold may decline intraday back towards key values of support. This includes today’s central pivot at $1,221.71 and the S1 pivot found at $1,218.57. A decline beneath this value should be seen as significant. This would place gold prices back below the daily point of resistance mentioned above, and put the commodity on track to next test the 10 day EMA at $1,213.00.
Gold Price, 30 Minute with Support & Resistance.

(Created Using IG Charts
Traders tracking sentiment should note that SSI values for gold continue to decline. Currently SSI reads at +1.38. While this number maintains a slightly bearish bias, with 58% of positioning long, traders should look for SSI to neutralize if gold prices climb. Alternatively if gold retreats from present levels, traders should look for sentiment values to increase back towards a positive extreme of +2.0 or more.

--- Written by Walker, Analyst for DailyFX.com
To Receive Walkers’ analysis directly via email, please SIGN UP HERE
See Walker’s most recent articles at his Bio Page.
Contact and Follow Walker on Twitter @WEnglandFX.


