


Talking Points
- Crude Oil Prices Break Higher to End Trading Week
- Short Term Values of Resistance Includes $48.63 and $48.96
- What’s next for Crude Oil and Commodities? Learn more with our Trading Guide
The price of Crude Oil is set to close the day higher, which means the commodity has rallied for the last three consecutive session. Technically, today’s price action has Crude Oil trading above a key line of descending resistance. This trendline, as seen below, has been created by connecting a series of lower highs in Crude Oil price in the last two trading months. If Crude Oil remains supported here, it may suggest that the commodity is prepared to rally further. However, a late day move back below yesterday’s close of $47.70 may alternatively suggest the development of a false breakout.
Crude Oil Price, Daily with Trendline
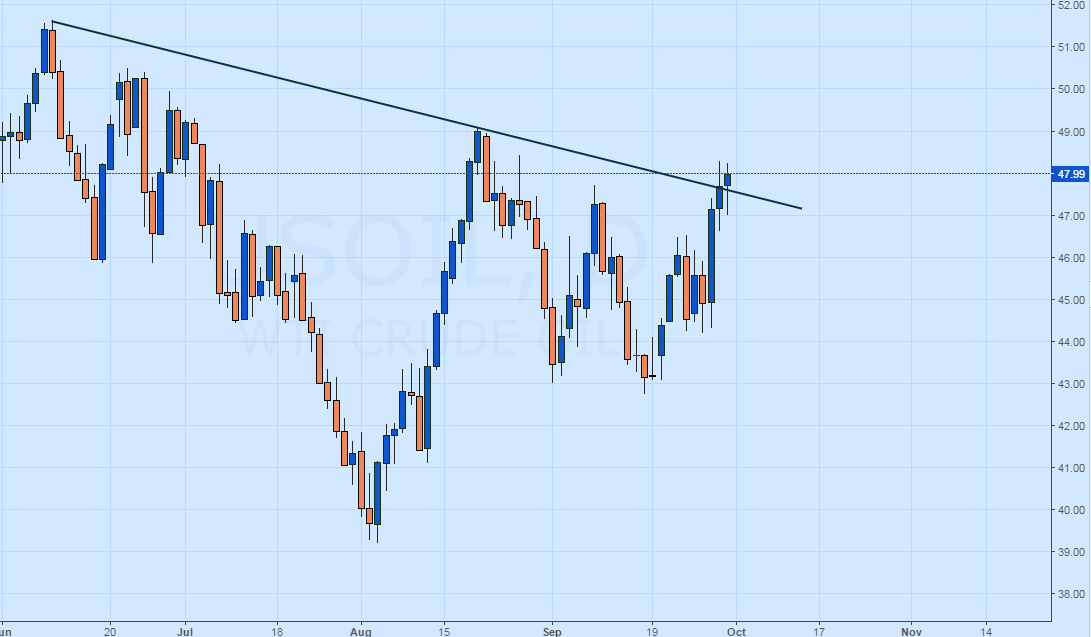
(Created with TradingView)
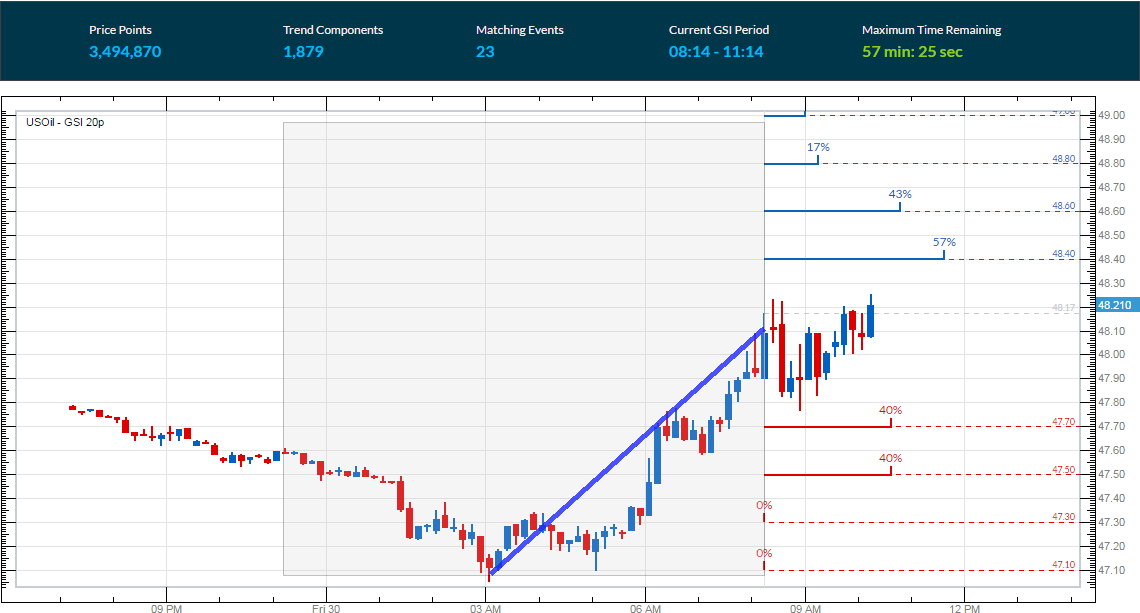
In the 10-minute graph below, Crude Oil prices can be seen trading just off their daily high of $48.26. The Grid Sight Index (GSI) has deciphered this morning’s price movement as a short-term uptrend, with Crude Oil putting in a series of technical higher highs. After reviewing 3,494,870 pricing points, GSI has also indicated that price action has continued to advance by $0.23 or more in 57% of the reported 23 matching historical events. A move through the first displayed bullish price distribution at $48.40 would place Crude Oil prices at a new daily high. In this scenario, traders may look for Crude Oil to test other values of resistance, including $48.63 and $48.96.
Alternatively, GSI has indicated that prices have declined by $0.47 or more in 40% of the identified historical instances. This places the first bearish historical distribution for Crude Oil at $47.70. A move through this value may signal a retracement of this morning’s bullish price action. Further declines in price may then open the commodity up to test current daily lows, which are found at $47.02.
Want to learn more about GSI? Get started learning about the Index HERE.
---Written by Walker England, Market Analyst
To Receive Walkers’ analysis directly via email, please SIGN UP HERE
See Walker’s most recent articles at his Bio Page.
Contact and Follow Walker on Twitter @WEnglandFX.


