


Talking Points
- Gold Prices Trade Towards Support at $1,310.71
- Intra Day Gold Breakouts Begin Over $1,333.21
- Get the latest analysis on Gold prices with our Q3 Gold Trading Guide.
Gold prices continue to consolidate, despite breaking out from a $20 range between $1,355.00 and $1,335.00 last week. Prices are now heading towards the next value of daily support at $1,310.71. This price represents the July 2016 swing low in gold, and if the commodity stays above this value it would suggest that gold prices may be trading in a descending triangle. Technically, from this point the price of gold may bounce back towards resistance near $1,350.00 or continue to trade lower beneath triangle support.
Gold Price (Ticker:XAU/USD) Daily Chart

Traders watching for a bullish reversal in price, back towards triangle resistance, should continue to monitor the R4 Camarilla pivot found at $1,333.21. If the price of Gold trades above this point of intraday resistance it opens up the metal to extend its gains on an intraday breakout. Currently price action is trading at today’s central pivot $1,320.01. If the price of Gold declines, traders may first look for support near today’s S3 pivot at $1,313.41. A breakout below this value would be significant as it exposes the triangle line of support mentioned above, followed by the S4 pivot at $1,306.81.
Gold Price (Ticker:XAU/USD) 30 Minute
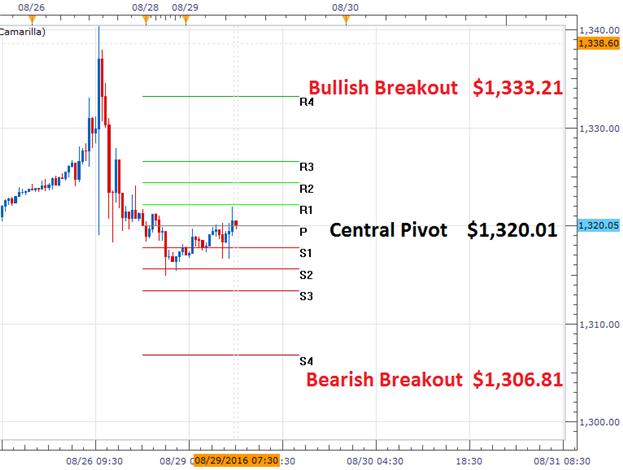
(Created by Walker England)
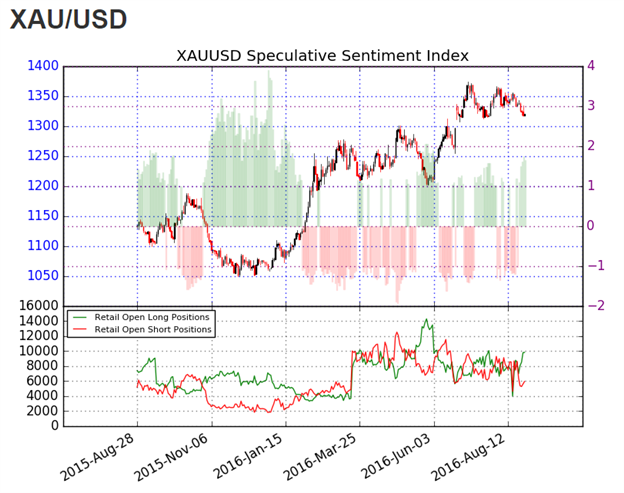
The ratio of long to short positions for Gold (Ticker: XAU/USD) stands at +1.67. This SSI (speculative sentiment index) reading shows that 63% of positioning is currently long. Typically a positive reading in SSI suggests that the price of gold may decline further. Alternatively, if prices continue to rebound back towards resistance, it would be expected for SSI to move back towards more neutral values.
To Receive Walkers’ analysis directly via email, please SIGN UP HERE
See Walker’s most recent articles at his Bio Page.
Contact and Follow Walker on Twitter @WEnglandFX.


