


Talking Points
- Crude Oil Declines For a Second Consecutive
- Critical Daily Support Found at $46.95
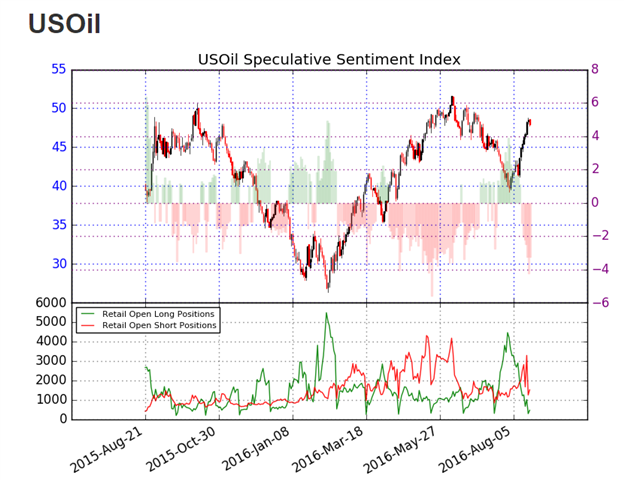
- Sentiment Remains Extreme ; 77% of Positioning is Short
Access Our Free Q3 Oil Outlook HERE
The price of WTI Crude Oil (CFD:USOil) is trading lower for the second consecutive day this week, after failing to breakout above critical resistance at $48.97. This value is found as a 78.6% Fibonacci retracement level, measured from the June 2016 high ($51.64) to the August 2016 low ($39.17). Crude Oil prices are now testing support at $46.87. This value is represented in the graph below as the previous 61.8% retracement value, and is also the July 12th swing high.
WTI Crude Oil Price (UsOil), Daily Chart

(Created by Walker England)
Short term price action for the price of Crude Oil may be seen in the 10 minute graph below. Currently, the Grid Sight Index (GSI) is also highlighting a short term uptrend, with a series of higher highs as the price of Crude advances from its daily low at $46.60. After reviewing 3,476,459 pricing points, GSI has indicated that price action has continued to advance $0.23 or more in 54% of the 35 matching historical events. This places today’s first bullish distribution at a price of $47.26, and a move to this price may suggest that Crude Oil may at least find temporary support for the session.
Alternatively, GSI has indicated that prices have declined by $0.48 or more in 20% of the identified historical matches. This places today’s first bearish distribution at $46.55. If prices trade through this point, Crude Oil prices would be trading at fresh daily lows. In this scenario traders may look for bearish momentum to increase with prices potentially trading towards next support at $45.81.
WTI Crude Oil (UsOil) 10Minute GSI Chart

Sentiment for WTI Crude Oil (Ticker: USOil) remains at a negative extreme, with SSI (speculative sentiment index) reading at -3.26. With 77% of positioning now net short, this may indicate further gains for Crude Oil prices. In the event that Crude Oil prices continue to trade lower, traders may look for SSI to move off of its current negative extreme back towards more neutral values.
To Receive Walkers’ analysis directly via email, please SIGN UP HERE
See Walker’s most recent articles at his Bio Page.
Contact and Follow Walker on Twitter @WEnglandFX.


