


Talking Points
- Crude Oil Technical Strategy: Favoring Upside Over $46.00
- Critical Daily Resistance Found at $46.90
- Sentiment Flips Negative Pointing Toward Price Advances; 55% of Positioning is Short
Access Our Free Q3 Oil Outlook HERE
The price of WTI Crude Oil (CFD:USOil) is breaking higher this week, after advancing in the last four consecutive trading sessions. Crude Oil prices had previously been supported by its 200 day MVA at $40.30, and they are now breaking out above a descending value of trendline resistance. With yesterday’s breakout above $46.00, traders will continue to watch for the next point of resistance at $46.90.
WTI Crude Oil Price (UsOil), Daily Chart
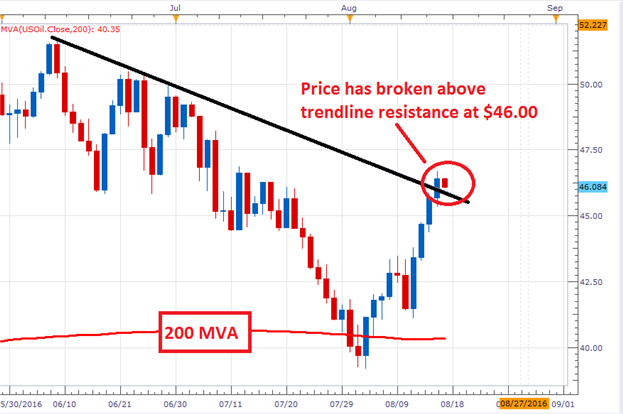
(Created by Walker England)
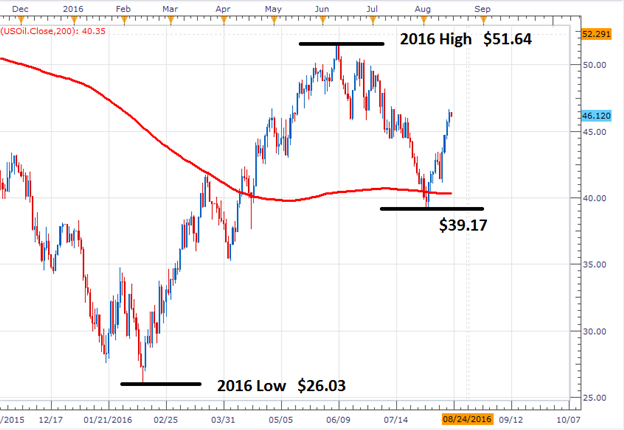
This daily breakout, has signaled a resumption of bullish momentum after Crude Oil put in a new monthly low at $39.17. This low is still working as a value of support, and is now considered a higher swing low in a broader uptrend beginning from the 2016 low of $26.03. A move through short term values of resistance should be viewed as significant, as it opens up Crude Oil prices to trade back towards yearly highs found at $51.64.
Traders should note that if prices fail to stay above the descending trendline depicted above, and price action closes below yesterday’s low, it would invalidated yesterday’s breakout . In this scenario where price are rejected at resistance, Crude Oil prices may be setting into a broader consolidating pattern.
WTI Crude Oil (UsOil) Daily Chart
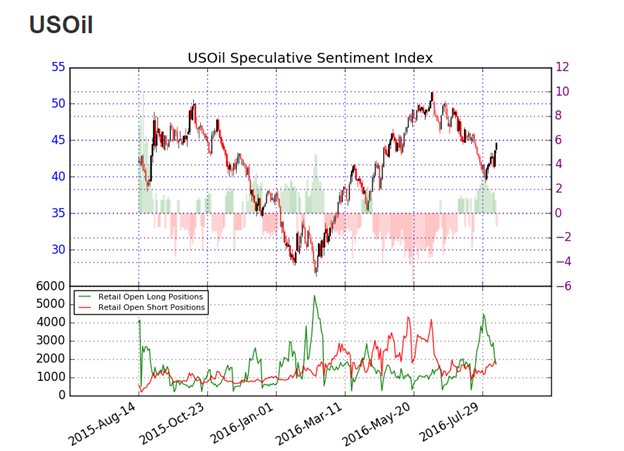
Sentiment for WTI Crude Oil (Ticker: USOil) has flipped negative, with SSI (speculative sentiment index) reading at -1.05. Yesterday’s reading for reference stood at +1.22. With 55% of positioning now net short, this may indicate further gains for Crude Oil prices. In the event that Crude Oil prices continue to breakout higher, traders may look for SSI to move towards a negative extreme of -2.0 or more. Alternatively if Crude Oil is rejected at resistance, SSI may flip back to a positive reading.
To Receive Walkers’ analysis directly via email, please SIGN UP HERE
See Walker’s most recent articles at his Bio Page.
Contact and Follow Walker on Twitter @WEnglandFX.


