


Talking Points
- GBP/USD Breaks Higher on Positive Inflation Data
- Daily GBP/USD Daily Highs Sit at 1.2966
- What’s next for the GBP/USD and US Dollar Pairs? Learn more with our Trading Guide
The British Pound has broken out significantly higher this morning, with the GBP/USD trading to new weekly highs at 1.2996. This surge in price has been predicated on new post “Brexit” inflation data being reported better than expected this morning. CPI figures were expected at 0.5% (YOY) (JUL), and posted at 0.6%. Now with prices trading just off of the daily high, traders will be looking to see the pair move and potentially break the psychological 1.3000 figure. Short term traders will also be watching intraday support for the GBP/USD at 1.2961. A move through this value would suggest the beginning of a retracement of this morning’s move.
GBP/USD, 15 Minute Chart & breakout
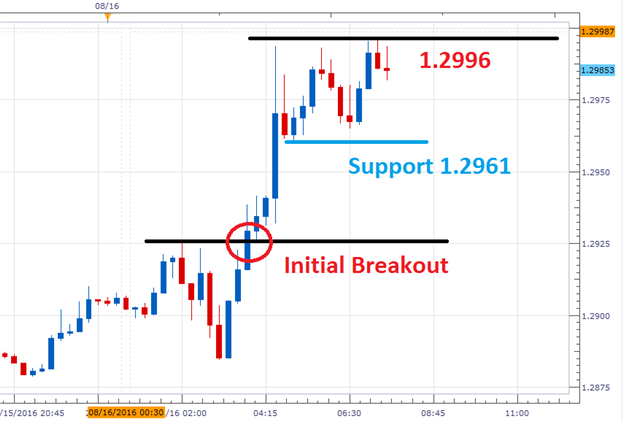
(Created by Walker England)
In the 5 minute graph below, the GBP/USD can be seen trading just below the previously mentioned daily high. The Grid Sight Index (GSI) is currently highlighting a short term uptrend, with the pair bouncing from its most recent swing low at 1.2965. After reviewing 29,351,378 pricing points, GSI has indicated that price action has advanced 16 pips or more in 51% of the 82 matching historical events. A move through today’s first bullish price distribution at 1.2998 would be significant, as this would place the GBP/USD at new daily highs.
Alternatively, GSI has indicated that prices have declined by 30 pips or more in just 27% of the 82historical matches. Today’s first bearish distribution is found at 1.2952. A move through this value would place the pair below short term support at 1.2961. This would suggest that this morning’s earlier bullish momentum has subsided, and that the beginning of a GBP/USD retracement is in play.
Want to learn more about GSI? Get started learning about the Index HERE.

Sentiment for the GBP/USD has declined as prices have advanced, with SSI (speculative sentiment index) reading at +2.11. Even though SSI has declined from its weekly peak, this value is still at a positive extreme. Typically, a positive extreme suggests that there may be further declines in price. If the GBP/USD does continue to breakout higher, trades should look for SSI to continue to neutralize and potentially flip to a negative reading. Alternatively if the GBP/USD begins to decline from this morning’s high, it would be expected to see sentiment figures remain extreme.

To Receive Walkers’ analysis directly via email, please SIGN UP HERE
See Walker’s most recent articles at his Bio Page.
Contact and Follow Walker on Twitter @WEnglandFX.


