


Talking Points
- USD/JPY Trades to New Daily Highs, Tests Critical Resistance
- Trendline Resistance for the USD/JPY is Found Near 107.00
- If you are looking for more trading for US Dollar check out our Trading Guides
The USD/JPY continues to trade higher this morning and is quickly moving on key daily resistance near 107.00. This line of resistance is marked on the USD/JPY graph below, and represents a descending trendline. This line has been created by connecting both the February 2016 high at 121.68 with the May 2016 at 111.44. If price breaks above resistance, it would suggest at least a temporary end to the pair’s ongoing 2016 downtrend. Alternatively, a turn at this critical charting point would suggest a return in price to yearly lows, which now reside at 98.78.
USD/JPY, Daily Chart with Trendline
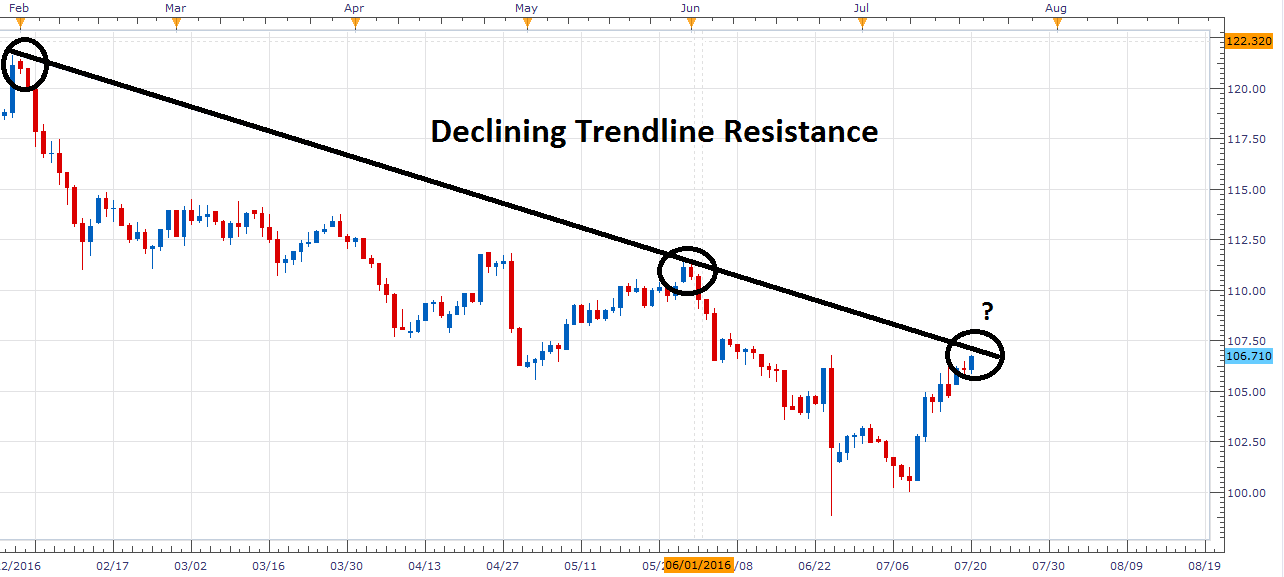
(Created by Walker England)
In the graph below, we can see the USD/JPY breaking out towards new daily highs. The Grid Sight Index has currently identified a short-term uptrend with the creation of a shot term uptrend over the last 90 minutes of trading. After reviewing 75,187,405 pricing points, GSI has indicated that price action has declined by a minimum of 12 pips in 50% of the 292 matching historical events. A move through the first historic distribution, found at 106.88, would be interpreted as bullish and place the USD/JPY at new highs for the day. At which point, traders may look for price action to challenge the previously mentioned value of resistance.
Alternatively, traders may look for a retracement in price if the pair reaches the first bearish distribution found at 106.52. Prices declined 24 pips in 21% of the reviewed historical matches. A move through this point would expose the final bearish historical distribution at 106.16. Of the 292 historical matching events, price declined 60 pips or more in only 2% of instances.
Want to learn more about GSI? Get started learning about the Index HERE.
WTI Crude Oil (UsOil) 5Minute GSI Chart

Traders tracking sentiment should note that SSI readings for USD/JPY have flipped negative for the first time since 2015. While today’s sentiment reading is relatively flat at -1.06, traders should mark this change in positioning as significant. If the USD/JPY does break higher, trader should look for SSI to move lower to a negative extreme of -2.0 or greater. Alternatively, if the USD/JPY is rejected at resistance, SSI may flip back positive as prices decline.

To Receive Walkers’ analysis directly via email, please SIGN UP HERE
See Walker’s most recent articles at his Bio Page.
Contact and Follow Walker on Twitter @WEnglandFX.


