


Talking Points
- EUR/USD Trades Lower From Daily High at 1.1126
- Ascending Support for the EUR/USD is Found at 1.1078
- If you are looking for more trading ideas for the Euro, check out our Trading Guides
The EUR/USD opened higher this morning, but so far has failed to convincingly, to break out above last Friday’s NFP high at 1.1120. Today’s session high currently stands at 1.1126, but price action is now trading lower after being rejected at resistance. If prices continue to decline, traders should look for the EUR/USD to test a key line of ascending support near1.1078. This trend line is depicted in the graph below, and has been created by connecting a series of short-term swing lows.
EUR/USD Price, 30 Minute Chart

(Created by Walker England)
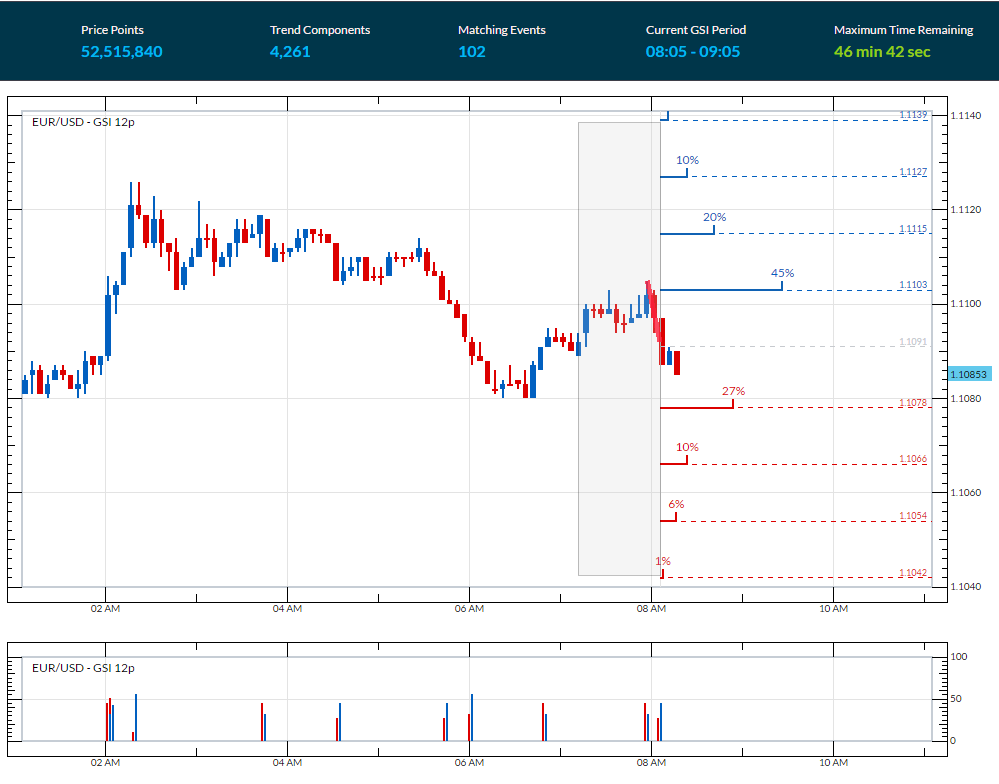
As the EUR/USD turns towards support, traders should continue to monitor short-term momentum for a potential bounce or breakout in price. Displayed in the 5-minute chart below, the EUR/USD may be seen trending lower from today’s high. GSI has specifically picked up on a short term downtrend in the last half hour by highlighting a series of newly printed lower lows on the 5minute chart. After reviewing 52,515,840 pricing points, GSI has indicated that price action has declined by a minimum of 13 pips in 27% of the 102 matching historical events. Today’s first bearish distribution matches trend line support at 1.1078. If prices reach this point, traders may consort GSI for more historical data to validate either a breakout or potential reversal in price.
Of the matching historical outcomes, prices advanced 12 pip in 45% of instances. A move to this point would suggest renewed bullish momentum for the pair. In addition, it should be noted that prices rose higher by 36 pips in just 10% of the 102 matching events. A move of this nature would have price action testing the daily high, as well as today’s third bullish distribution point at 1.1127
EUR/USD 5 Minute GSI Chart
Want to learn more about GSI? Get started learning about the Index HERE.
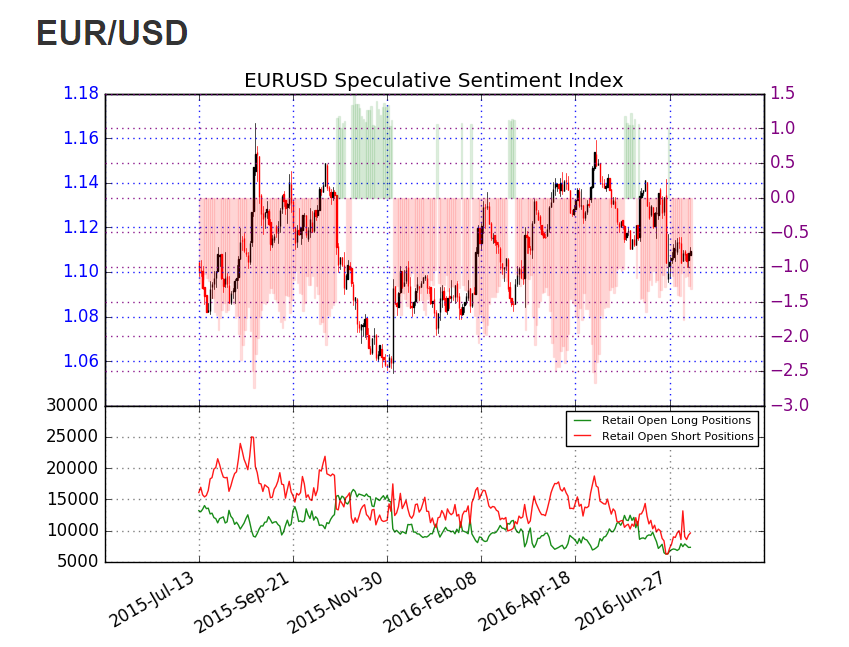
SSI (speculative sentiment index) for the EUR/USD currently stands at -1.31. With 57% of positioning short, SSI has a slight bias towards further EUR/USD gains. In the event of a bullish breakout, negative SSI values should increase to read at -2.0 or better. Alternatively, in the event that the EUR/USD trades through support, traders should watch for SSI to neutralize and potentially flip towards a positive reading.
To Receive Walkers’ analysis directly via email, please SIGN UP HERE
See Walker’s most recent articles at his Bio Page.
Contact and Follow Walker on Twitter @WEnglandFX.


