


Talking Points
- WTI Crude Oil Price Turns Below Resistance at $51.06
- Bullish Breakouts Opens Crude Oil Prices to Test $60.84
- A Bearish Turn Suggests a Return to Oils Long Standing Downtrend
WTI Crude Oil (CFD: US OIL) prices have closed lower for the previous four consecutive sessions. This decline in prices occurred immediately after Crude Oil tested and failed to breakout from critical resistance found near $51.06. This point is graphically displayed below as a measured move from the April 2016 low at $35.22.
Looking for additional trade ideas for Crude Oil and Commodities? Check out our Trading Guide
WTI Crude Oil Daily Chart with Key Resistance
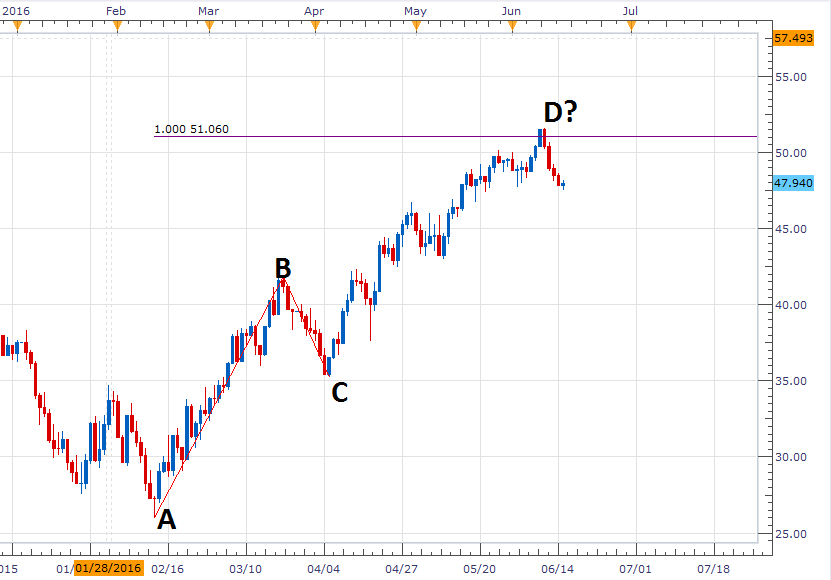
(Created using Marketscope 2.0)
Going into this afternoon’s FOMC rate decision traders should continue to monitor values of support and resistance. A breakout above $51.06 would invalidate the highlighted measured move, and open prices to test the next Fibonacci extension near $60.84. Alternatively, if prices trade lower, it may open Crude Oil Prices to trade towards new monthly lows below $47.53. As Crude Oil prices begin to reflect newly developed market data, traders may also elect to use a series of trading tools to help gauge the changes in market conditions.
The Grid Sight Index
Traders may monitor these key values going into today’s FOMC event using the Grid Sight Index (GSI). This trading tool is designed to review millions of historical pricing points in real time. Then it studies those events to show you how often the trend continued or reversed in the past. This information can be extremely helpful for traders looking to pinpoint a market turn or in conjuncture with a breakout based strategy.
For those that are unfamiliar with the Grid Sight Index, you can review our tutorial and find real time updated data HERE.
Speculative Sentiment Index
The Speculative Sentiment Index (SSI) can also help traders decipher the market by identifying the direction of retail positioning. Currently SSI is reading at -1.23 for US OIL. This number suggests that 55% of current positioning is net long the market. Typically, SSI is read as a contrarian indicator. This means if Crude Oil prices advance, it would be expected that SSI totals decline further. Alternatively, if prices reverse lower, it would be expected that SSI would increase towards values that are more neutral.
If you are new to trading with SSI, view our training video and download the free indicator HERE.
To Receive Walkers’ analysis directly via email, please SIGN UP HERE
See Walker’s most recent articles at his Bio Page.
Contact and Follow Walker on Twitter @WEnglandFX.


