


Talking Points
- The EUR/USD has failed to break lower under 1.0812
- SSI reads slightly bullish at -1.1630
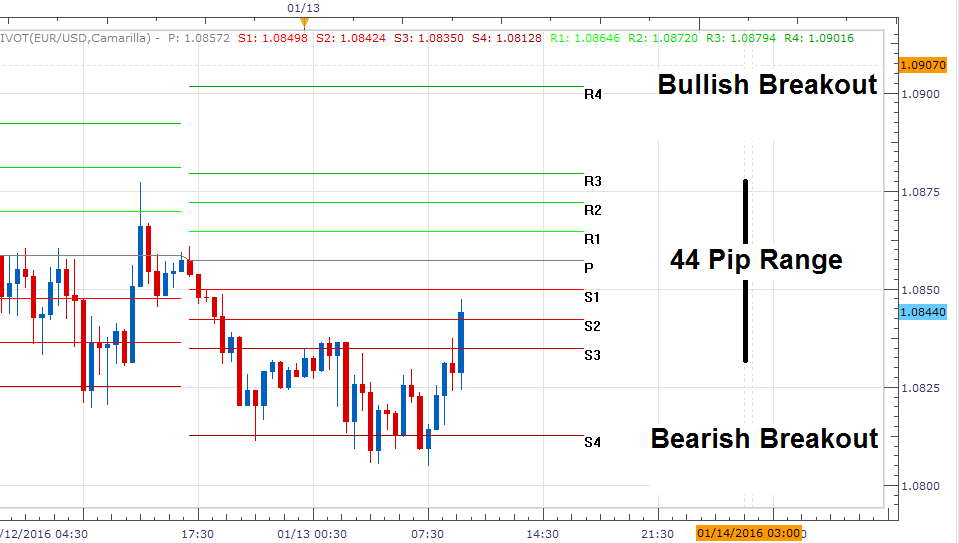
- Bullish breakouts begin over 1.0901
(Created using Marketscope 2.0 Charts)
Losing Money Trading Forex? This Might Be Why.
The EUR/USD has failed to breakout lower this morning, after an early test of support found at 1.0812. However, after testing this point, which is represented above by the S4 Camarilla pivot, prices have now rebounded back inside of today’s trading range. This rebound in price may suggest at least a temporary stem in the bearish momentum that has caused the EUR/USD to drop as much as 164 pips this week. Traders looking for a bullish reversal for the pair should continue to monitor the S3 pivot point, at 1.0835. A continued move above this value opens prices to test points of resistance including the R3 pivot point at 1.0879.
Even though prices are currently trading away from today’s S4 pivot point, prices may be prone to breakout later in the US trading session. A move back through values of support would suggest a return to the bearish momentum seen earlier in the week. Conversely, a move above the R4 pivot at 1.0901 would be significant, as price action would be breaking out to a new weekly high. In this bullish scenario, a 1X extension of today’s 44-pip pivot range places potential targets near 1.0945.
SSI (Speculative Sentiment Index) for the EUR/USD is currently reading at -1.1630. While this number is not at an extreme, it does read slightly bullish with more positions short than long. If the pair continues to strengthen, trend traders can use the index as a confirmation tool as more short positions are established in an attempt to fade a newly developing trend.
To Receive Walkers’ analysis directly via email, please SIGN UP HERE
See Walker’s most recent articles at his Bio Page.
Do you know the biggest mistake traders make? More importantly, do you know how to overcome the biggest mistake? Read page 8 of the Traits of Successful Traders Guide to find out [free registration required].
Contact and Follow Walker on Twitter @WEnglandFX.
Video Lessons || Free Forex Training
Trading Using Fibonacci (13:08)
Reading the RSI, Relative Strength Index (13:57)


