


Talking Points
- Candlestick analysis can be used to spot market reversals and resumptions of trends.
- The bullish engulfing pattern can spotted inside the Three Outside Up pattern.
- Candles can be used as a confirmation tool, and used for Forex entries
Understanding candlestick charts and their patterns allow traders to work price action into an existing Forex trading strategy. Normally candle patterns such as the Bullish Three Outside Up can be used to confirm a change of trend, or even validate a market entry. With this idea in mind we will focus on recognizing and trading one of the markets most clear candle patterns.
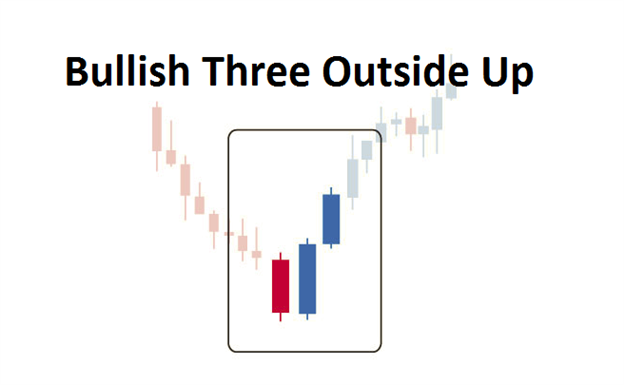
The Three Outside Up
A Three Outside Up candle pattern may sound complicated at first, but it is actually a derivation of the bullish engulfing pattern. Pictured above we can see the Three Outside Up pattern is comprised of three individual candles. The first candle should close down and will depict the end of a currency pair’scurrentweakness. This first candle can close with a variety of body and wick sizes and can vary from chart to chart.While it is notdirectly related to the next engulfing pattern, this candle should denote the end of the markets current decline.
The second and third candles in the pattern are arguably the most important. As seen above, the second candle is expected to engulf the first with a large blue candle. This large bullish engulfing candle signifies new strength in the market as price attempts to break to higher highs. To be considered a complete bullish engulfing candle price of the second candle should close well above the high of the first candle. Lastly, candle number three is used to validate the current change in market direction. This candle should open immediately higher, creating as small a wick to the downside as possible. Upon closing above candle two, candle three will validate the new bullish market bias.
Let’s look at a current example.
Learn Forex – GBPUSD Daily Trend

(Created using FXCM’s Marketscope 2.0 charts)
Uses in Trading
Above we can see the Bullish Three Outside Up in action on the GBPUSD currency pair. The daily graph has been in a long standing established uptrend, but notice there has been dips along the way. There have been three candle patterns, which have been highlighted in the chart, showing prices return back in the direction of the trend. The last of which signaled the August 2013 bottom for the pair, before rallying as much as 1158. So how can this be worked into a trading plan?
Traders looking to take advantage of the Bullish Three Outside Down pattern can add it into any existing trending market plan. Most traders will use it as a confirmation tool such as SSI to signal a change in market direction. If the market has a bias upward, like the GBPUSD chart above, traders can use this candle pattern to establish new buying positions.
New to the FX market? Save hours in figuring out what FOREX trading is all about.
Take this free 20 minute “New to FX” course presented by DailyFX Education. In the course, you will learn about the basics of a FOREX transaction, what leverage is, and how to determine an appropriate amount of leverage for your trading.


