


Talking Points:
-USDOLLAR was the largest gainer over the past week
-Shift in SSI readings suggests further gains are possible for USDOLLAR
-Buy USDOLLAR Currency Basket
The Federal Open Market Committee meeting this week provided the fuel to ignite the sleeping markets. Several currency pairs are trading near their 200 period Simple Moving Averages on the 4 hour chart. This suggests the markets are generally range bound and staying close to their averages.
However, there is one currency, the United Stated Dollar, which jolted awake and climbed up the Strong & Weak chart noted below. When comparing the price of the exchange rates relative to their 200 period Simple Moving Average, the Greenback changed trend the most and is now considered the strongest currency according to the Strong & Weak analysis.
(To learn more about the importance of trading with moving averages, enroll for this free Moving Average course. Learn how to determine trend direction using moving averages. The course will take about 15 minutes to complete.)
Forex Strategy: Matching Strong versus Weak
| Currency | Up Arrows | Down Arrows | Change From Last Report |
|---|---|---|---|
| USD | 4 | Higher 5 rankings | |
| EUR | 3 | Down 1 ranking | |
| AUD | 2 | No Change | |
| CHF | 3 | 1 | Down 1 ranking |
| GBP | 3 | 1 | Higher 1 ranking |
| JPY | 2 | 3 | Down 2 rankings |
| NZD | 6 | Down 1 ranking | |
| CAD | 6 | No Change |
Chart created by DailyFX EDU Robert Warensjo
We have focused on the USDOLLAR quite a bit in our strong and weak analysis over the past several weeks. It all began September 22, 2013 when the Euro began thrusting higher.
As the USD was rebounding, the Euro wasn’t backing down. As a result the EURUSD pair finished the week on its highs. Also, when looking at the EURUSD weekly chart, there is a cluster of resistance in the 1.3750-1.3850 range. Therefore, this indicates to me that although the USD may perhaps find support, the EUR still has room to run higher against the USD.
“Euro Spurts and Maintains Strength” September 22, 2013
Then, a couple weeks later, a very tight range developed as the US Debt ceiling painted the USDOLLAR in a corner. A trading plan was presented with “the easiest way to determine [direction] is wait for price to break above resistance or below support.”
Eventually, prices did break lower and the USDOLLAR sell trade was entered. Eventually, the EURUSD pushed into the 1.3750-1.3850 resistance zone and both trades were closed down. As noted last week’s piece:
“The lack of follow through has me concerned about broad based USDOLLAR weakness. The single currency has several reasons to weaken, yet it remains stubborn. Therefore, be careful that the oversold levels may revert back to the mean and the Buck might actually strengthen.”
As a result, the USDOLLAR appeared poised for strength.
Now, that the USD has proven itself, the landscape is changing that we can seek out USDOLLAR strength to buy.
Forex Education: USDOLLAR Sentiment Readings (BEFORE)
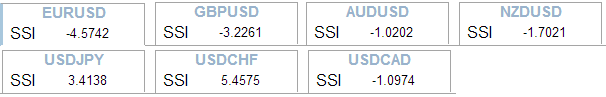
From October 25, 2013 (above) --- October 31, 2013 below
Forex Education: USDOLLAR Sentiment Readings (AFTER)

FXCM’s Speculative Sentiment Index (SSI)
We’ve shown these SSI readings for the past several reports. The important take away is how the sentiment towards the USDOLLAR has shifted. The USD bulls actually got it right during this past week and the USD strengthened.
Now that they are slightly into the profit, they are reducing their positions evidenced in the positioning changes above. For example, a change in the EURUSD SSI from -4.5 to -2.1 means the percentage of USD buyers reduced from 81% to 68%. This change in sentiment is part of the fuel behind a new bullish stance towards the Greenback.
Forex Education: USDOLLAR in a Trend Channel

(Created using FXCM’s Marketscope 2.0 charts)
As we can see above, the Greenback is stuck inside this red trend channel. The next level of resistance is near 10,575 so the dollar should have a clear road until then. Due to the confluence of resistance near 10,575, there should be a reaction at that level. If the value of the USD were to strengthen above the 10,575 strong resistance, then that would likely confirm a medium to longer term bull market is kicking off.
Executing the Trade
Since we don’t know which currencies the USDOLLAR is likely to outperform against, so we will take a diversified approach and buy the USDOLLAR against a basket of currencies.
We recommend risking less than 5% on all open trades. As a result, risk less than 1-2% on this basket so you have additional capacity to take on other trades.
Good luck with your trading!
---Written by Jeremy Wagner, Head Trading Instructor, DailyFX Education
Follow me on Twitter at @JWagnerFXTrader.To be added to Jeremy’s e-mail distribution list, click HERE and select SUBSCRIBE then enter in your email information.
See Jeremy’s recent articles at his DailyFX Forex Educators Bio Page.
Want to keep on top of the Dollar’s move and what fundamental news is pushing it?
Join DailyFX on Demand where you can receive real time analysis of your trading ideas, real time SSI, and bank research of how funds are flowing. FXCM clients receive a discount. Join HERE.


