


Talking Points
- Oscillator divergence can be used to identify Forex reversals.
- Traders will look for indicators to separate from price to pinpoint diverging markets.
- Traders can take advantage of divergence, by using a variety of trend based strategies.
Many traders look at oscillators such as RSI, CCI and Stochacstics for their overbought and oversold levels. While using these levels can be helpful to traders for pinpointing entries, there is another way to use oscillators that is often overlooked. Divergence is a potent tool that is imbedded inside of oscillators that can be used to spot potential market reversals by comparing an indicator with market direction.
Let’s take a look at how divergence works, using the AUDUSD Daily graph seen below.
Learn Forex – AUDUSD Daily Trends

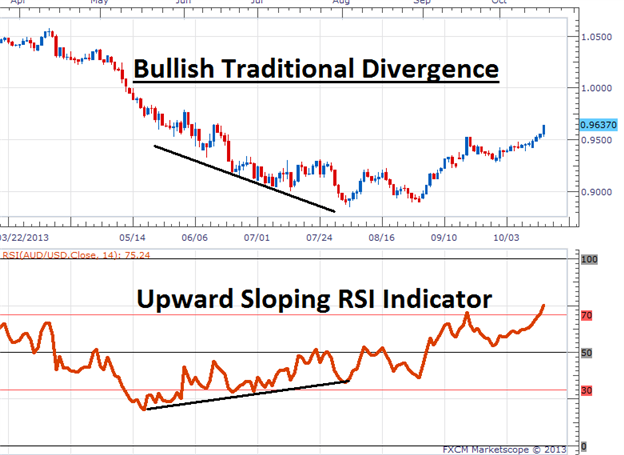
The word divergence itself means to separate and that is exactly what we are looking for today. Typically Oscillators such as RSI will follow price as the AUDUSD declines. So when the AUDUSD goes lower, usually so will the indicator. (If you’re unfamiliar with RSI – Register for Our Free Course Here). Divergence occurs when price splits from the indicator and they begin heading in two different directions. In the example below, we can again see the AUDUSD daily chart with RSI doing just that.
To begin our analysis in a downtrend, we need to compare the lows on the graph. In a downtrend prices should consistently be making lower lows. That is exactly what the AUDUSD does as it declined as much as 1734 Pips between March and August 2013. To find divergence, it is important to mark the dates of these lows as we need to compare them with the lows created on the RSI indicator. Now notice how, we can see RSI making a series of higher lows at the same points. This is exactly the divergence we are looking for!
Learn Forex – AUDUSD Bullish Divergence
Once spotted traders can then employ the trend based strategy of their choosing while looking for price to swing against the previous trend and break to higher highs. It is important to note that when trading price reversals, indicators can stay overbought and oversold for long periods of time. As with any strategy traders should be using stops to contain their risk. One method to consider in a downtrend is to employ a stop underneath the current swing low or other supported area of price.
---Written by Walker England, Trading Instructor
To contact Walker, email instructor@dailyfx.com. Follow me on Twitter at @WEnglandFX.
Want to learn more about trading RSI? Take our free RSI training course and learn new ways to trade with this versatile oscillator. Register HERE to start learning your next RSI strategy!


