


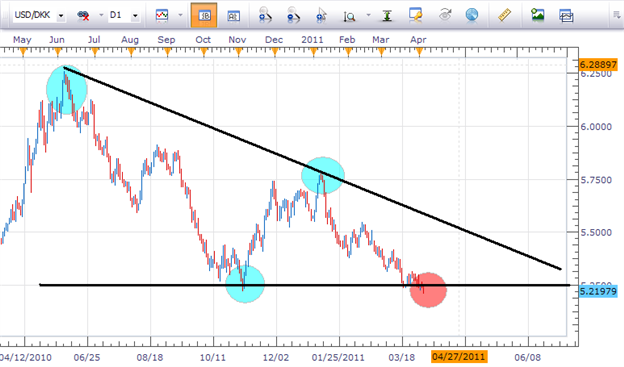
Triangle patterns can offer us frequent and easily identifiable trend based trading opportunities if we keep an eye out for them. Today a descending triangle is forming on the USD.DKK (Dollar/Danish Krone) currency pair on the daily chart. These formations are normally seen as continuation patterns and form when at least two descending highs form a trend line.
It is also critical that there is a minimum of two lows established at the bottom of the triangle. These low points will link together and a horizontal line of support. The two lows do not have to be exact, however if there is not a bounce in price we can quickly find ourselves in a breakout environment.
Price Action
Taking price in to a 4hr chart, we can find a solid down trend in place dating back to the February 14th high of 5.5520. If our triangle pattern is correct we would need to see a break in price action above the current 4hr trend line and head to the top of the triangle, (long term resistance) denoted by the red line on the chart below. Our CCI indicator is currently in oversold territory below -100 and a cross above this level can be used for confirmation of price returning to resistance.

Trading Opportunity
Our descending triangle being a bearish continuation pattern should get us looking for short trades with the direction of the trend. My preference is to use a series of entry orders along our upper trend line near the 5.5000 handle. Stops should be set above our trend line and limits can be set at the bottom of our triangle near 5.2500 giving us a greater than 1:2 Risk-Reward setting for the trade.
An alternate approach can also be taken if price breaks lower through support. We can use a breakout strategy and enter a break below 5.2000 and place stops over old support (now resistance) at 5.2500.
Next: Trading Price Action "Triangles" (20 of 47)
Previous: Trading the Bullish Morning Star


