


Market Condition: Trend Retracement
Target 1: Psychological Support 2.300
Target 2: October Low 2.2419
Invalidation: Breakout over 2.3500
GBPNZD 1 Day Chart
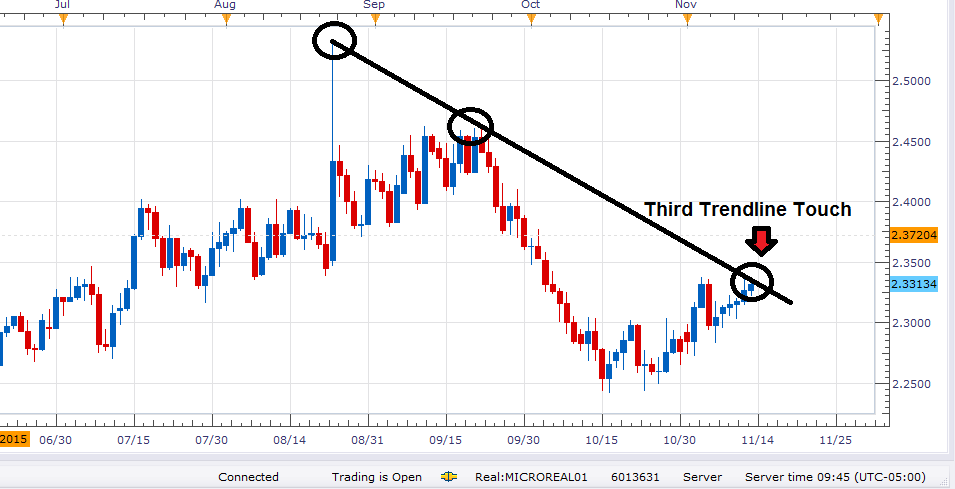
(Created using Marketscope2.0 Charts)
After declining as much as 2899 pips from the August high at 2.5318, the GBP/NZD has retraced to trend line resistance. As depicted above, this trend line has been extrapolated using the August and September highs for the pair. As the GBP/NZD is now trading near this descending trend line, it will allow positional traders an opportunity to rejoin the trend. In the event that the GBP/NZD resumes trading lower, initial targets can be set near the psychological support value of 2.3000. Further targets can look for a trend continuation beneath the October low of 2.2419.
In the event that the market breaks above resistance, the current downtrend would at least temporarily be invalidated. At this point traders may select to conclude any short positions, while looking for other trend-based opportunities.
To Receive Walkers’ analysis directly via email, please SIGN UP HERE


