What I Like AUD/JPY Short:
The BIG Idea: JPY strength has accelerated on the back of trade tensions driving capital away from risky assets and economies with the high demand of external capital and into havens like treasuries. A move in US 10yr yields below 2.85% would further align with equity market weakness, which has been a global marvel alongside selling in base metals and emerging markets. JPY longs could enjoy the fruits of the risk-off move if this trend extends.
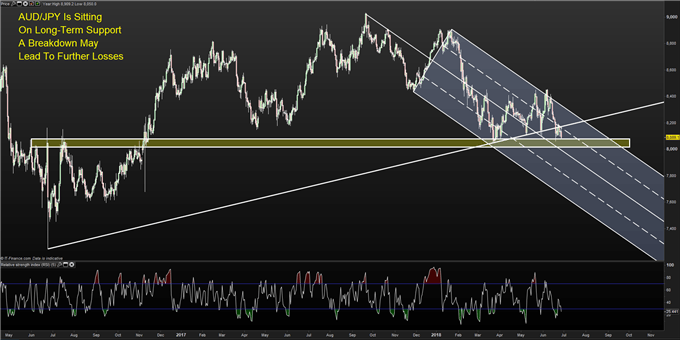
Point to Establish Short Exposure: Break & close below 80.50
Spot: 80.89 JPY per AUD
Target 1: 76.8 JPY per AUD (November 2016 low)
Target 2: 76.3 JPY per AUD (78.6% Fibo of 2016-2017 Range)
Invalidation Level: 82.08 JPY per AUD (June 8 low)
If you are looking for other strong trading ideas, you may enjoy our FREE Trading Guides
The BIG Picture:

Chart Source: Pro Real Time with IG UK Price Feed. Created by Tyler Yell, CMT
Traders have a tough decision on their hands with whether to bid or offer AUD per JPY at 81. The chart above helps to show that price is sitting at support, but it has come to support on the back of major global concerns around trade (where AUD is quite susceptible), a strengthening US Dollar and a drop in equities that could be set up for a good bit of volatility on its own accord.
A break below 80, which is the highlighted rectangle on the chart above would likely indicate a broader behavior change that would favor a move toward the November 2016 low of 76.8 JPY per AUD.
The invalidation of the move can be seen at the early June low of 82.50. A price move above this zone would favor the technical view that broader support has held.
Access our popular free trading guides to enhance your trading strategy here.
Looking For Influencing Factors in US Yields, Chinese Shares & USDCNH
From a global trade perspective, traders and investors appear to have their eyes on three key markets lately: UST 10Yr note yields, CSI 300 (Chinese A-Share Mainland stocks,) and the USD/CNH.
The former is moving lower in what could be a bearish head and shoulders. Lower yields are indicative of risk-off and as an accepted global proxy for risk appetite, lower US yields tend to align with lower AUD/JPY. The “line in the sand” on US 10Yr yields appear to be ~2.80%. Given that institutional traders are aggressively net-short (anticipating higher yields) a breakdown could cause a massive unwind that sees yields and JPY crosses lower.
Next, the CSI 300 Index known as the Shanghai Shenzhen A-share stocks have officially moved into a bear market from their January 26 peak of 4403.34. In today’s trading, the shares hit a 52-week low at 3,441.7. Much of its weakness has been attributed to concerns about trade wars along weakness of the home currency.
The other key market is USD/CNH, which is breathing the fresh air of YTD highs on the back of a strengthening USD. What traders should note is that the last time the CNH weakened this much, this fast against the USD was in August of 2015 when the PBoC devalued the Yuan and caused palpable panic in global markets.
Given the heightened trade ward fears that adds friction to global purchases and an increasingly weak CNH, another shock like the one witnessed on the US morning of August 24, 2015 would likely see equities around the world and AUD/JPY sharply lower. Even if the seemingly low-probability event doesn’t come to fruition, it does not serve AUD/JPY long bulls well that the factors are present at hand for a repeat performance.
Options Insight – A Jump in 1-Month Implied Volatility
One way I like to see if a potential theme is developing is via the options market. A key metric of any options valuation tool is implied volatility, which, of the inputs is the one that must be derived to make the price make sense. In the world of options, a higher price or premium is only justified by higher volatility that increases the probability of the option of moving in the money.
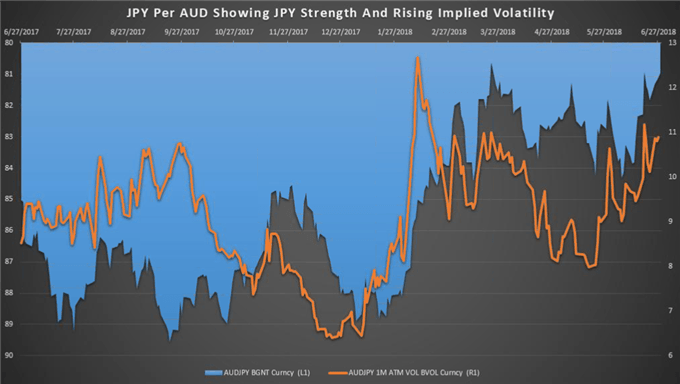
The 1M AUDJPY Implied Volatility (orange line) is showing a growing level as JPY strengthens against AUD as shown via a rising area on
the chart. As the implied volatility increases, the downside pressure on AUD/JPY that allows AUD to buy fewer JPY plays out.
Rising Implied Vol May Weight on AUD/JPY

Data source: Bloomberg
You can see that markets are suffering from a feedback loop problem. Yuan weakness is leading to risk aversion, which is causing concern that is leading to JPY strength, which tends to be causing more risk aversion.
TO READ MORE:
Are you looking for longer-term analysis on the U.S. Dollar? Our DailyFX Forecasts for Q2 have a section for each major currency, and we also offer a excess of resources on USD-pairs such as EUR/USD, GBP/USD, USD/JPY, AUD/USD. Traders can also stay up with near-term positioning via our popular and free IG Client Sentiment Indicator.
Forex Trading Resources
DailyFX offers a surplus of helpful trading tools, indicators and resources to help traders. For those looking for trading ideas, our IG Client Sentiment shows the positioning of retail traders with actual live trades and positions.
Our trading guides bring our DailyFX Quarterly Forecasts and our Top Trading Opportunities; and our real-time news feed has intra-day interactions from the DailyFX team. And if you’re looking for real-time analysis, our DailyFX Webinars offer numerous sessions each week in which you can see how and why we’re looking at what we’re looking at.
If you’re looking for educational information, our New to FX guide is there to help new(er) traders while our Traits of Successful Traders research is built to help sharpen the skill set by focusing on risk and trade management.
---Written by Tyler Yell, CMT
Tyler Yell is a Chartered Market Technician. Tyler provides Technical analysis that is powered by fundamental factors on key markets as well as t1rading educational resources. Read more of Tyler’s Technical reports via his bio page.
Communicate with Tyler and have your shout below by posting in the comments area. Feel free to include your market views as well.
Discuss this market with Tyler in the live webinar, FX Closing Bell, Weekdays Monday-Thursday at 3 pm ET.
Talk markets on twitter @ForexYell


