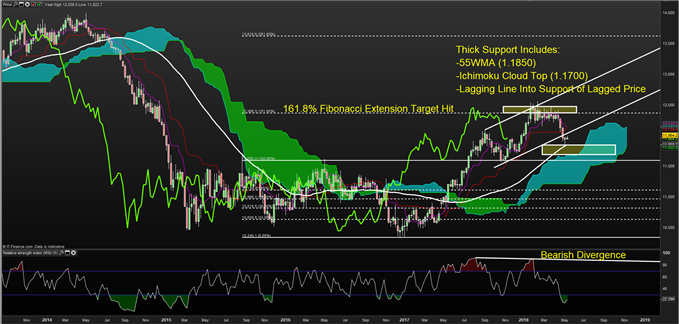
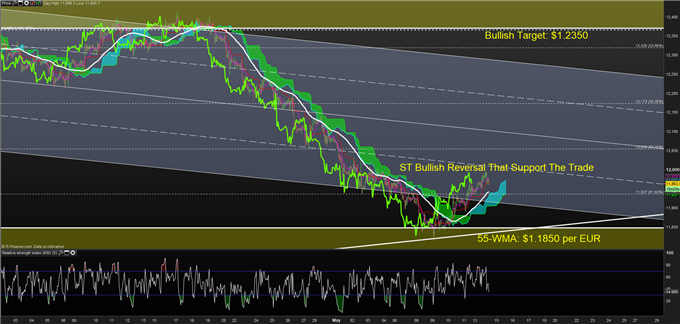
The BIG Idea: Weekly RSI(5) has recently touched the lowest point since March 2015. Additionally, positioning has over the last four weeks aggressively shifted for bulls to limit the EUR exposure, which may be getting overstretched against the broader view that US Dollar gains are only temporary. US Dollar bullish momentum per the 9-day midpoint of Ichimoku has recently reversed, and further profit taking could help EURUSD push toward $1.2225 against a stop of the 55-WMA at 1.1850.
Possible Fundamental Trigger: German ZEW expectations and GDP on Tuesday may show Q1 weakness was transitory, which may align with re-establishment of EUR longs.
Point to Establish Long Exposure: At Market
Spot: $1.1967 per EUR
Target 1: $1.2150 per EUR (9-Day Midpoint)
Target 2: $1.2366 per EUR (161.8% extension of March 2015, August 2015, January 2017 Range
Invalidation Level: Close < $1.1850 per EUR (55-Week Moving Average)
If you are looking for other strong trading ideas, you may enjoy our FREE Trading Guides
The BIG Picture:

Chart Source: Pro Real Time with IG UK Price Feed. Created by Tyler Yell, CMT
The four-year chart above shows the 2014-2017 range of EUR/USD from $1.3990 to $1.0350 per EUR. After the move higher stalled in February, there was a sharp move lower in mid-April that took the price from ~$1.2350 toward multiple forms of support.
Thick Support Includes:
-55WMA (1.1850)
-Ichimoku Cloud Top (1.1700)
-Lagging Line into Support of Lagged Price
Looking to the short-term chart, it appears that a bullish reversal may have taken place against such aggressive support that may align with an opportunity. The reversal is perceived via the Ichimoku cloud on a 1-hour chart that shows price and the lagging line (current price relative to 26-periods ago) above the previous price and cloud.
60-Minute EUR/USD Chart Shows Reversal of late-April's Bearish Move

Chart Source: Pro Real Time with IG UK Price Feed. Created by Tyler Yell, CMT
The short-term resistance on the hourly chart above would align with $1.2021/70, which makes up a prior polarity point from the move lower. Some traders are likely to see volatility around that level as some institutions have pointed that zone as an attractive sell point on increasing tensions between Italy’s Five Star and League reaching an agreement as a common coalition that has led to selling of BTPs (Italian bonds) and widened the spread between Bund-BTPs.
While last week’s short AUD/JPY continues to have an attractive macro component to it, if the US Dollar Bear reappears, EUR/USD would likely be ground zero for the move higher to resume so remain aware and keep an eye on the hourly Ichimoku chart.
TO READ MORE:
Are you looking for longer-term analysis on the U.S. Dollar? Our DailyFX Forecasts for Q2 have a section for each major currency, and we also offer a excess of resources on USD-pairs such as EUR/USD, GBP/USD, USD/JPY, AUD/USD. Traders can also stay up with near-term positioning via our popular and free IG Client Sentiment Indicator.
Forex Trading Resources
DailyFX offers a surplus of helpful trading tools, indicators and resources to help traders. For those looking for trading ideas, our IG Client Sentiment shows the positioning of retail traders with actual live trades and positions.
Our trading guides bring our DailyFX Quarterly Forecasts and our Top Trading Opportunities; and our real-time news feed has intra-day interactions from the DailyFX team. And if you’re looking for real-time analysis, our DailyFX Webinars offer numerous sessions each week in which you can see how and why we’re looking at what we’re looking at.
If you’re looking for educational information, our New to FX guide is there to help new(er) traders while our Traits of Successful Traders research is built to help sharpen the skill set by focusing on risk and trade management.
---Written by Tyler Yell, CMT
Tyler Yell is a Chartered Market Technician. Tyler provides Technical analysis that is powered by fundamental factors on key markets as well as t1rading educational resources. Read more of Tyler’s Technical reports via his bio page.
Communicate with Tyler and have your shout below by posting in the comments area. Feel free to include your market views as well.
Discuss this market with Tyler in the live webinar, FX Closing Bell, Weekdays Monday-Thursday at 3 pm ET.
Talk markets on twitter @ForexYell


