


Teaser: The Mexican Peso is one of the better proxies to see how risk is being bid up or offered while also offering strong trends for traders.
Point to Establish Short Exposure: Close below Kijun-Sen at 18.70585
Spot: 18.8518
Initial Target/Point to bring a stop to break even:18.5176 (200-DMA)
Swing Target (If not holding trade :) 17.9773 MXN per USD (78.6% Fib of 2017 Range)
Invalidation Level: 19.163 (Initial 2018 Opening Range Low, Set on January 5)
If you are looking to create your own trading ideas, you may enjoy our FREE Trading Guides
My Favorite trades are not those with the best setups. How a set up plays out is never known a priori. Instead, my favorite set-ups are often those with the best signaling power. In other words, if the trade works out, great! That’s why I risked my capital to jump in the trade.
However, if my trade doesn’t work out, there may be a regime shift in the markets that determine who is the top dog and possible where my focus should be concentrated. This thought has become a driver behind my new FX Overbought/ Oversold Report.
What Is The Message If My Trade Doesn’t Work Out?
USD/MXN is often seen as a proxy for risk-sentiment. Some traders prefer to work only with majors due to the wider spreads of EMFX, and they’ll use AUD/JPY as a riskproxy. Either way, a breakout or breakdown in USD/MXN tends to have signaling power.
Specifically, a large strengthening in the rate tends to argue that the falling MXN per USD is indicative of global capital flows favoring haven or at least safer assets. While a rising MXN per USD tends to indicate capital is running into previously perceived riskier economies.
Therefore, if my short USD/MXN trade doesn’t work and the market breaks above 19.163, my invalidation point, then I should shift my attention towards typical risk-off or short-EMFX trades. Conversely, I should look at the new strong-weak relationship in FX to see where the low hanging fruit may be lying.
Technical Outlook Favors Little Conviction Higher
After a strong move, the following counter move tends to tell how aggressive the forces are in the market. A sharp reversal tends to show traders that the most recent move is not a sure-fire bet as the new trend as there is either aggressive unloading or fighting off the prior move.
However, a sideways move, like the one seen in USD/MXN since January 25, may indicate rebalancing in the market, but not necessarily a breakout in the US Dollar or breakdown in the MXN. During this time, there have been rising concerns about NAFTA thanks to a potential ‘Trade War’ that’s caught headlines.
Access our popular free trading guides to enhance your trading strategy here.
USD/MXN Chart Momentum Indicator, Ichimoku Cloud Applied
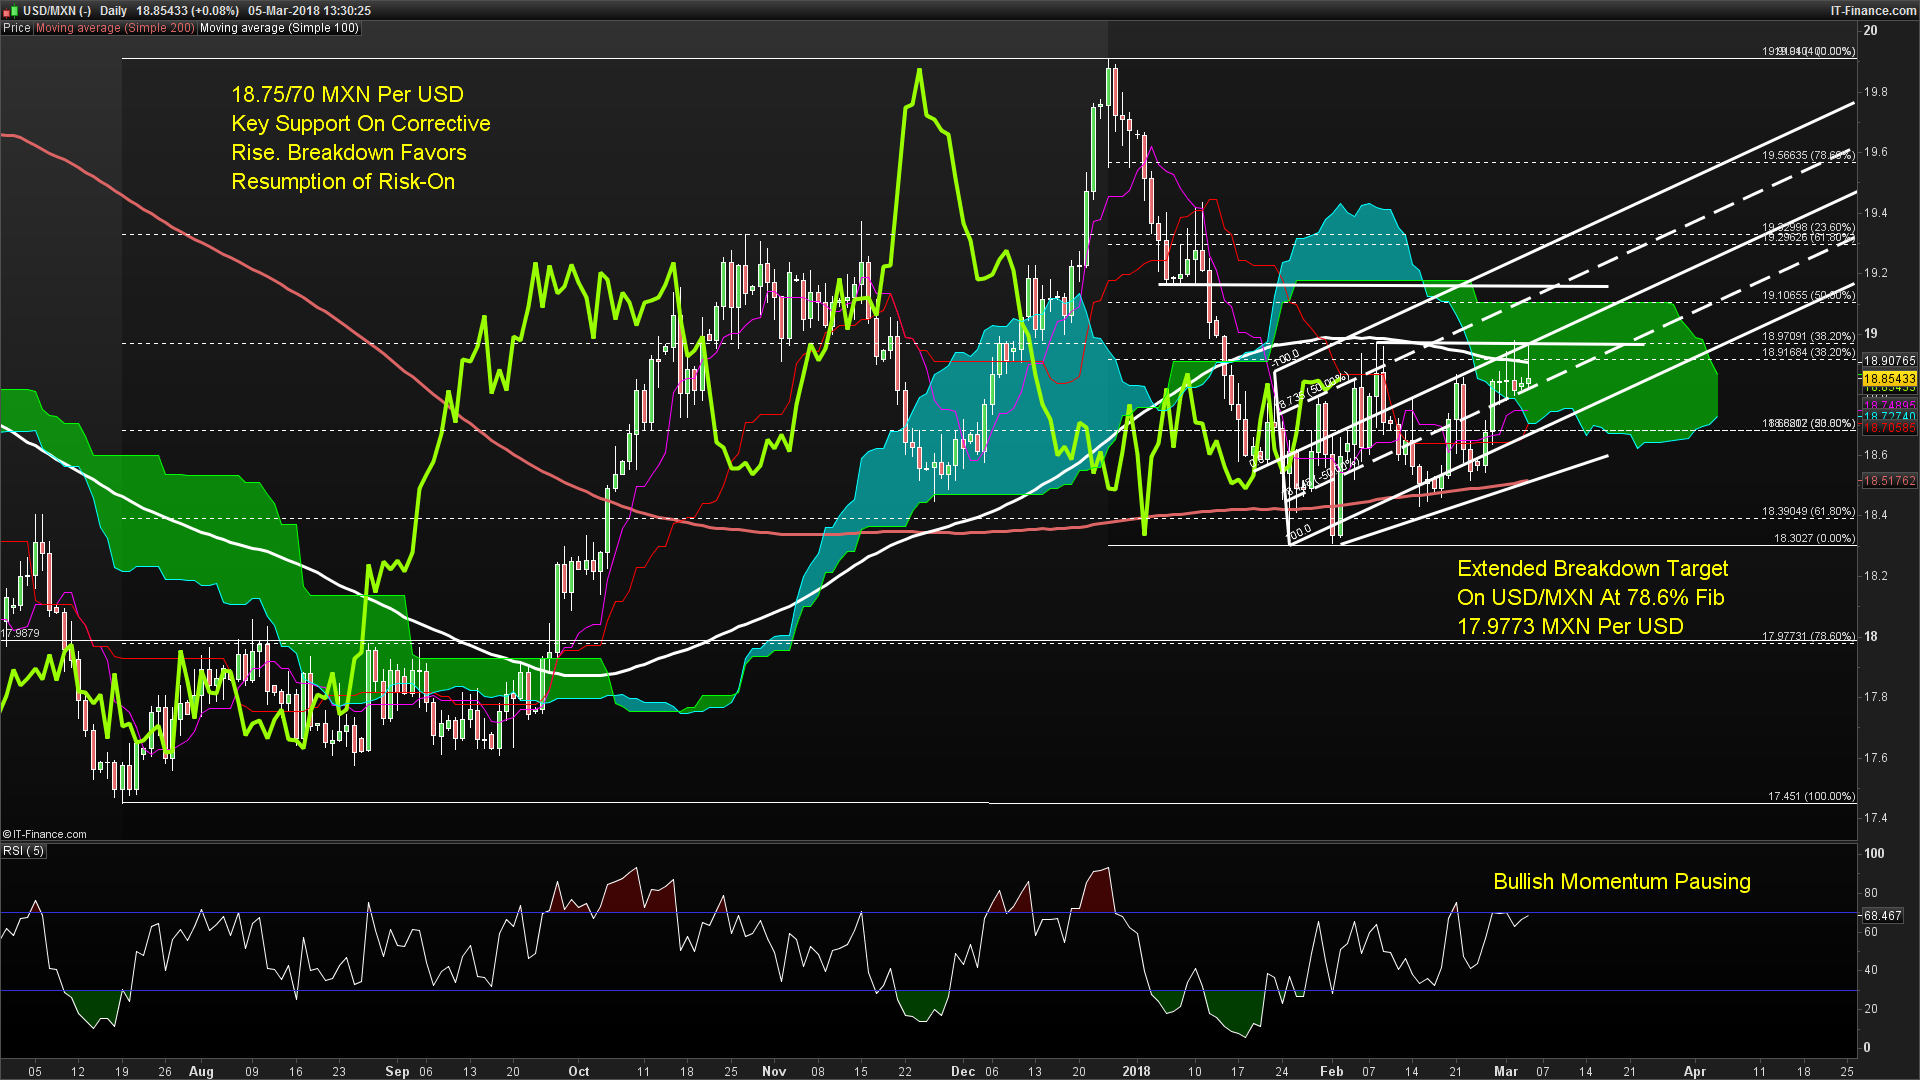
Chart created by Tyler Yell, CMT
Intermarket Analysis of Gold May Complement USD/MXN’s Fall
Traders can employ Intermarket Analysis to look at correlated markets for directional cues. USD/MXN and the price of Gold can often fill this void. USD/MXN has a 20-day rolling correlation to Gold of -0.85. In other words, if Gold (XAU/USD) rises by 1%, USD/MXN will fall by 0.85%, or a Gold strength aligns with MXN strength.
Significant Inverse Correlation of XAU/USD to USD/MXN
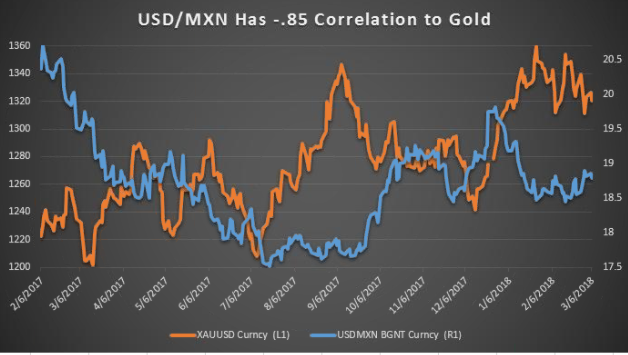
Data Source: Bloomberg
Such a correlation does not likely align with a risk-off environment, but rather, an inflationary risk-on environment.
Traders can use this to keep an eye on both markets. Given the strong inverse correlation, if Gold moves higher, chances are this trade is working out. If Gold moves lower, we may be moving into a fundamentally new environment that will bring about its own opportunities.
New to FX trading? No worries, we created this guide just for you.
---
Written by Tyler Yell, CMT
Tyler Yell is a Chartered Market Technician. Tyler provides Technical analysis that is powered by fundamental factors on key markets as well as t1rading educational resources. Read more of Tyler’s Technical reports via his bio page.
Communicate with Tyler and have your shout below by posting in the comments area. Feel free to include your market views as well.
Discuss this market with Tyler in the live webinar, FX Closing Bell, Weekdays Monday-Thursday at 3 pm ET.
Talk markets on twitter @ForexYell
Join Tyler’s distribution list.


