


Bias: Long Gold As Central Banks Likely To Cry ‘Uncle’ Into 2017
Point to Establish Long Exposure: Spot at the Market
Spot: 1,322.75
Target 1: 1,358 Post-Brexit High
Target 2: 1,433.8 August 2013 High
Invalidation Level: Close below 1,250 (EU-Referendum Low)
Fundamental & Technical Focus:
The “wisdom of crowds” has failed financial markets and those that bet that the United Kingdom would remain in the EU were shocked to see a Brexit”. As we see, a rise of separatist’s movements and “unprecedented customer demand for foreign currency transactions,” per Thomas Cook in the UK so it stands to reason that stores of value like Gold could do very well. Doing well for Gold would not be a new event in 2016. So far, Gold has risen ~28% YTD to the June 24, 2016, high.
In the aftermath of the EU-Referendum that led to the ‘Brexit’ outcome, we have seen US Yields plummet the most on record. The 2-year yield fell to 0.49%, which is the market's way of saying, at this moment we highly doubt the Federal Reserve will hike until 2018 at best.
It is not a long shot of the imagination that interest rates will not rise. It is also not a stretch to say that the initial catalyst for XAUUSD to burst higher at the beginning of the year with China Fears now has additional fodder with uncertainty surrounding both the UK & EU. Therefore, given the fundamental environment, and soon to be explained, the technical environment, XAUUSD may continue to outperform as the top asset in 2016 and beyond.
Chart:
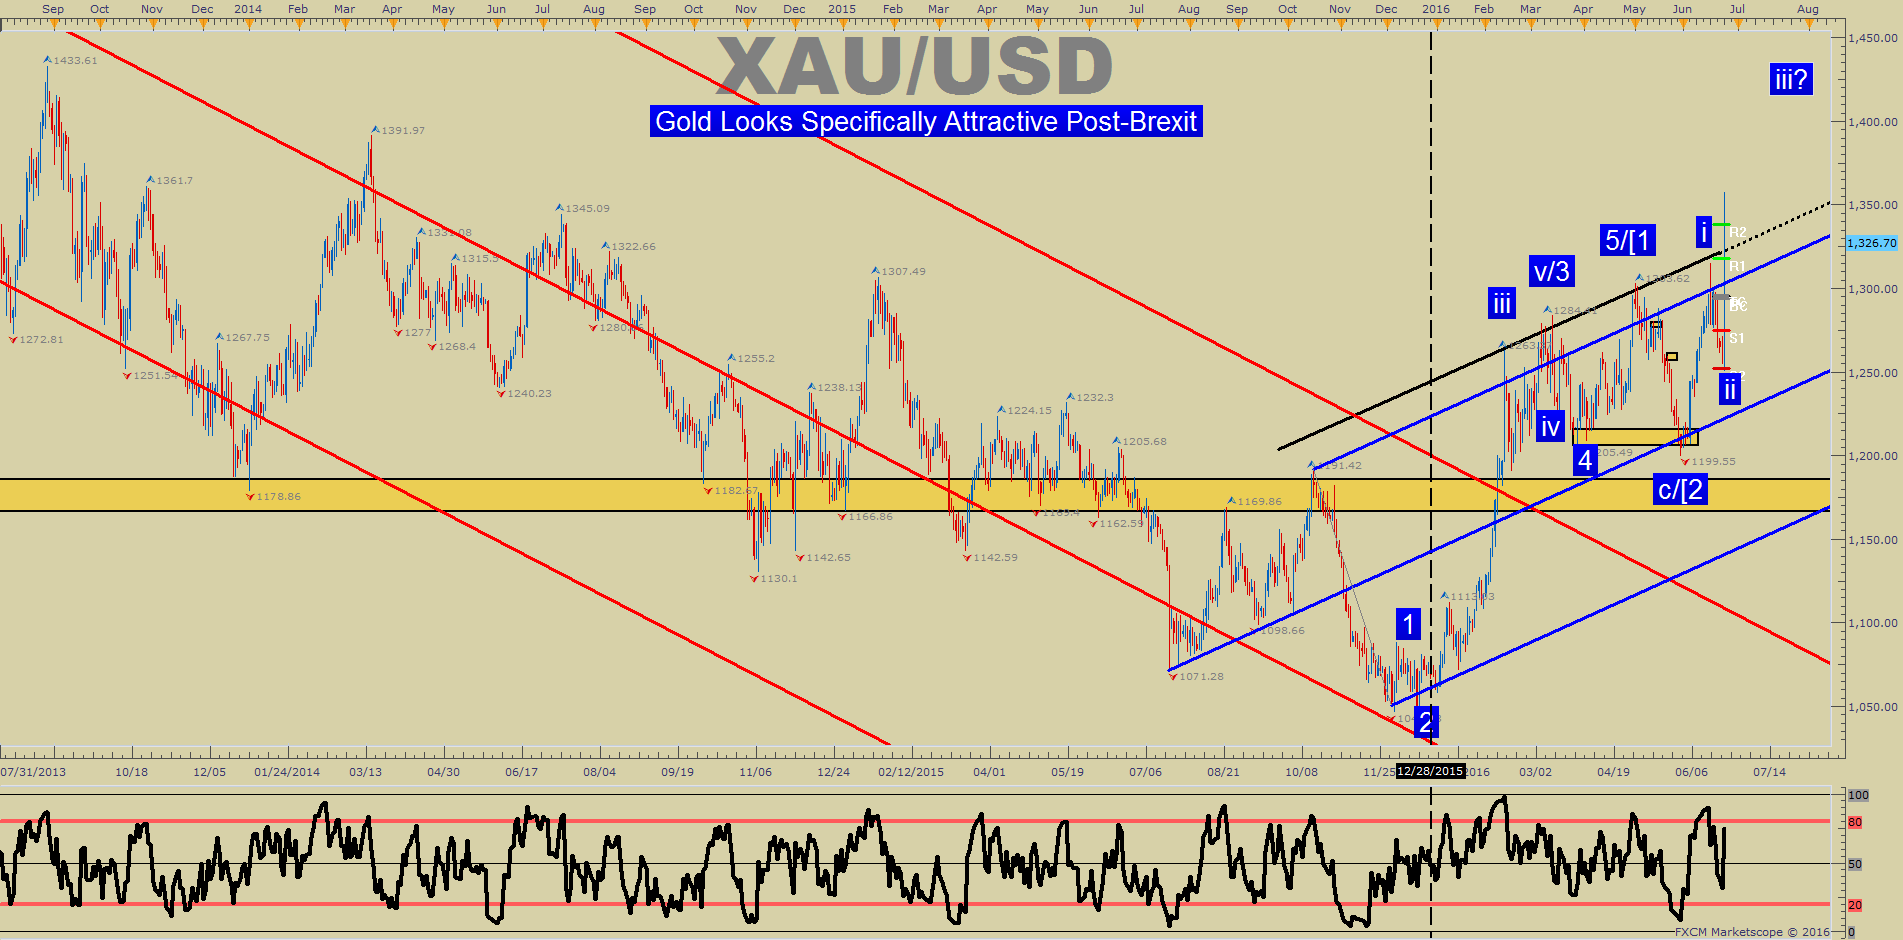
Since 2011, Gold has fallen from such great heights as 1920 down to the late 2015 lows of 1045. However, ~7 months after the 1045 print, Gold has appreciated ~28%.
From an Elliott Wave perspective, we could have a breakout on our hands that is heading toward the August 2013 high of $1,433 and beyond. Elliott Wave analysis is complicated, albeit invaluable in my view, but the crux of Elliott Wave is finding and trading the third wave of a five-wave sequence. The third wave is typically the steepest and most aggressive wave, and it appears we’re close to the environment that would favor such a development.
Another Technical Indicator that I have become fond for over the years is Ichimoku cloud. The Cloud acts as support in an uptrend and resistance in a downtrend. If nothing else, as long as the price of Gold remains above the Ichimoku cloud, currently at ~1265 that sits very close to today’s low of 1,250 which is the invalidation of the pattern.
Ichimoku Applied To XAUUSD (Daily Chart)
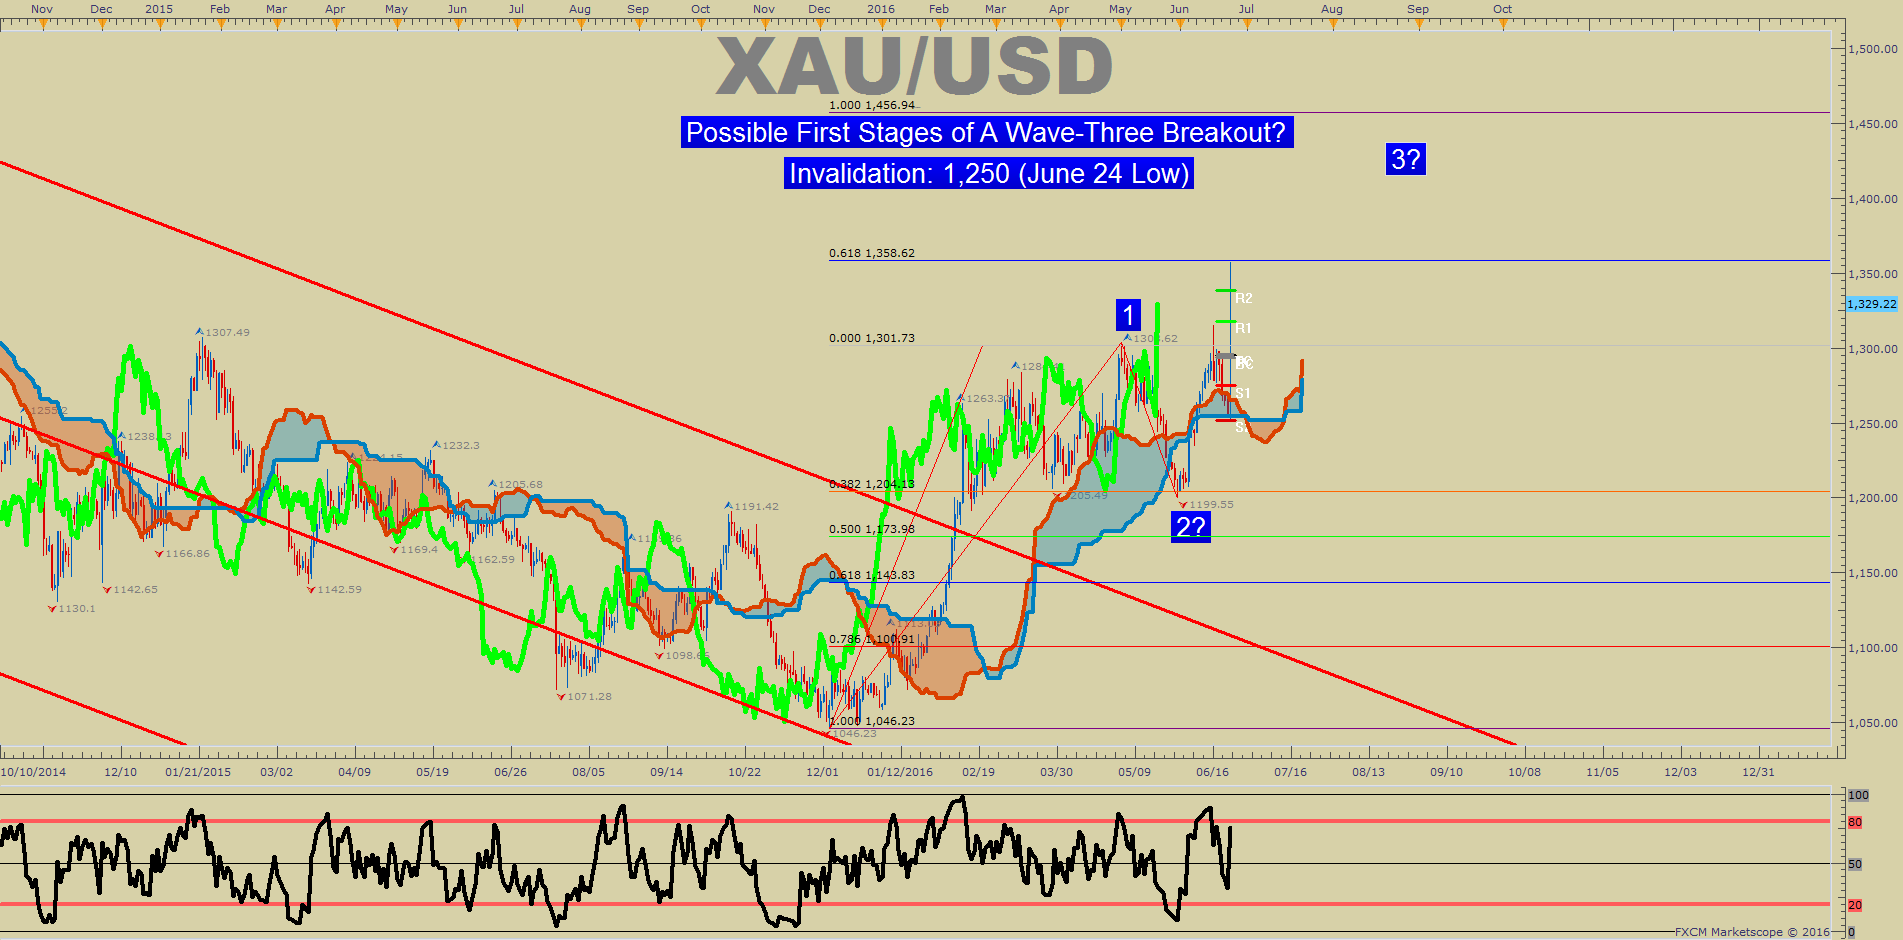
XAUUSD Resistance & Support Levels
2nd resistance: 1,358 61.8% Extension (If This Is A Wave 3, We Should Exceed This Level)
1st resistance: 1,338 Weekly R2 Pivot
Spot: 1,328
1st support: 1,295 Weekly Pivot
2nd support: 1,250 June 24 Low (Pre EU Referendum Outcome)
While an entry at the market may seem extreme, if this is a wave 3, then a breakout could be soon upon us. The trade’s target aligns with a favorable risk: reward ratio that our Traits of Successful Traders report found to be one of the best things a trader can do to ensure long-term sustainability in your trading.
Trader Sentiment Shows XAUUSD Could Move Either Way:
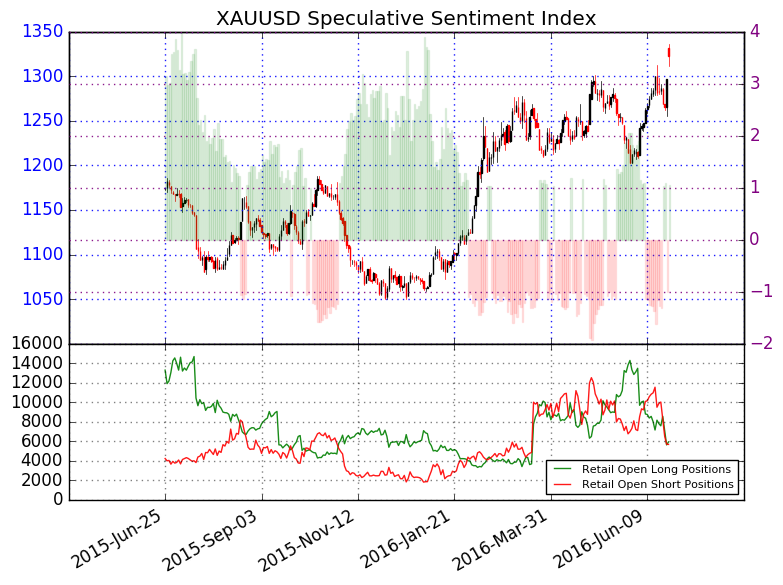
The ratio of long to short positions in the XAUUSD stands at 1.10, as 52% of traders are long. Yesterday the ratio was 1.16; 54% of open positions were long. Long positions are 16.3% lower than yesterday and 9.4% below levels seen last week. Short positions are 11.2% lower than yesterday and 30.2% below levels seen last week. Open interest is 13.9% lower than yesterday and 38.2% below its monthly average. We use our SSI as a contrarian indicator to price action, and the fact that the majority of traders are long gives a signal that the XAUUSD may continue lower. The trading crowd has grown less net-long from yesterday but unchanged since last week.


