


To receive Tyler’s analysis directly via email, please SIGN UP HERE
Point to Establish Short Exposure: Retracement toward 1.5570-1.5770 (38.2-61.8% of Recent Drop)
Spot: 1.5365
Target 1: 1.4952 2016 Opening Range Low
Target 2: 1.4800 9-Month Channel Support (See Chart Below)
Invalidation Level: Close above 1.5875 (January 21, Lower-High)
Fundamental & Technical Focus:
The Davos script aligned nicely with ECB President Draghi’s statements on Thursday about Central Bank willingness. The willingness is to ease further markets under tension whether through rate cuts or QE expansion. At the start of 2016, the EUR has been in a precarious situation as it attempts to find which side of the fence regarding relative strength it belongs. Against the “risk-off” currencies, EUR has been decidedly weak to start the year. Against the commodity currencies & relatively dovish central banks like the Bank of England who noted that now is not the time to think about rate hikes, the EUR has been up to start the year by multiple percentage points. However, depending on Draghi’s follow through at the March ECB meeting, that EUR strength could be outdated.
On Friday, we had an impressive move higher in WTI Crude Oil after bouncing off 18-year chart support to give us the strongest 2-day rally since late 2008. At the same time, the dollar began to wobble, which further provided support for Oil & the Canadian Dollar. These events aligned with Draghi’s dovish script at the ECB meeting mentioned earlier, which all together brought a strong price move lower off channel resistance, which keeps the view remaining bearish. A natural retracement through profit taking or waning sentiment that happens on a day-to-day basis can bring around a better best place to enter a short position making the risk: reward more favorable. Only a move above the 1.5875 would change the outlook from bearish to neutral, and nullify the trade idea.
Right now, our Trader Sentiment Indicator SSI is providing a neutral bias. This reading on SSI sits between -1.5 & +1.5, which shows us that positioning is not extreme, and the market is rather open to influence from external events. The ratio of long to short positions in the EURCAD stands right above -1.5, as roughly 65% of traders are short. We would want to see a move to and through +1.5 on SSI to have the wind of SSI at our back. A price move toward 1.15570-5775 and SSI moving to +1.5 or higher would further put our attention on further gains.
Chart:
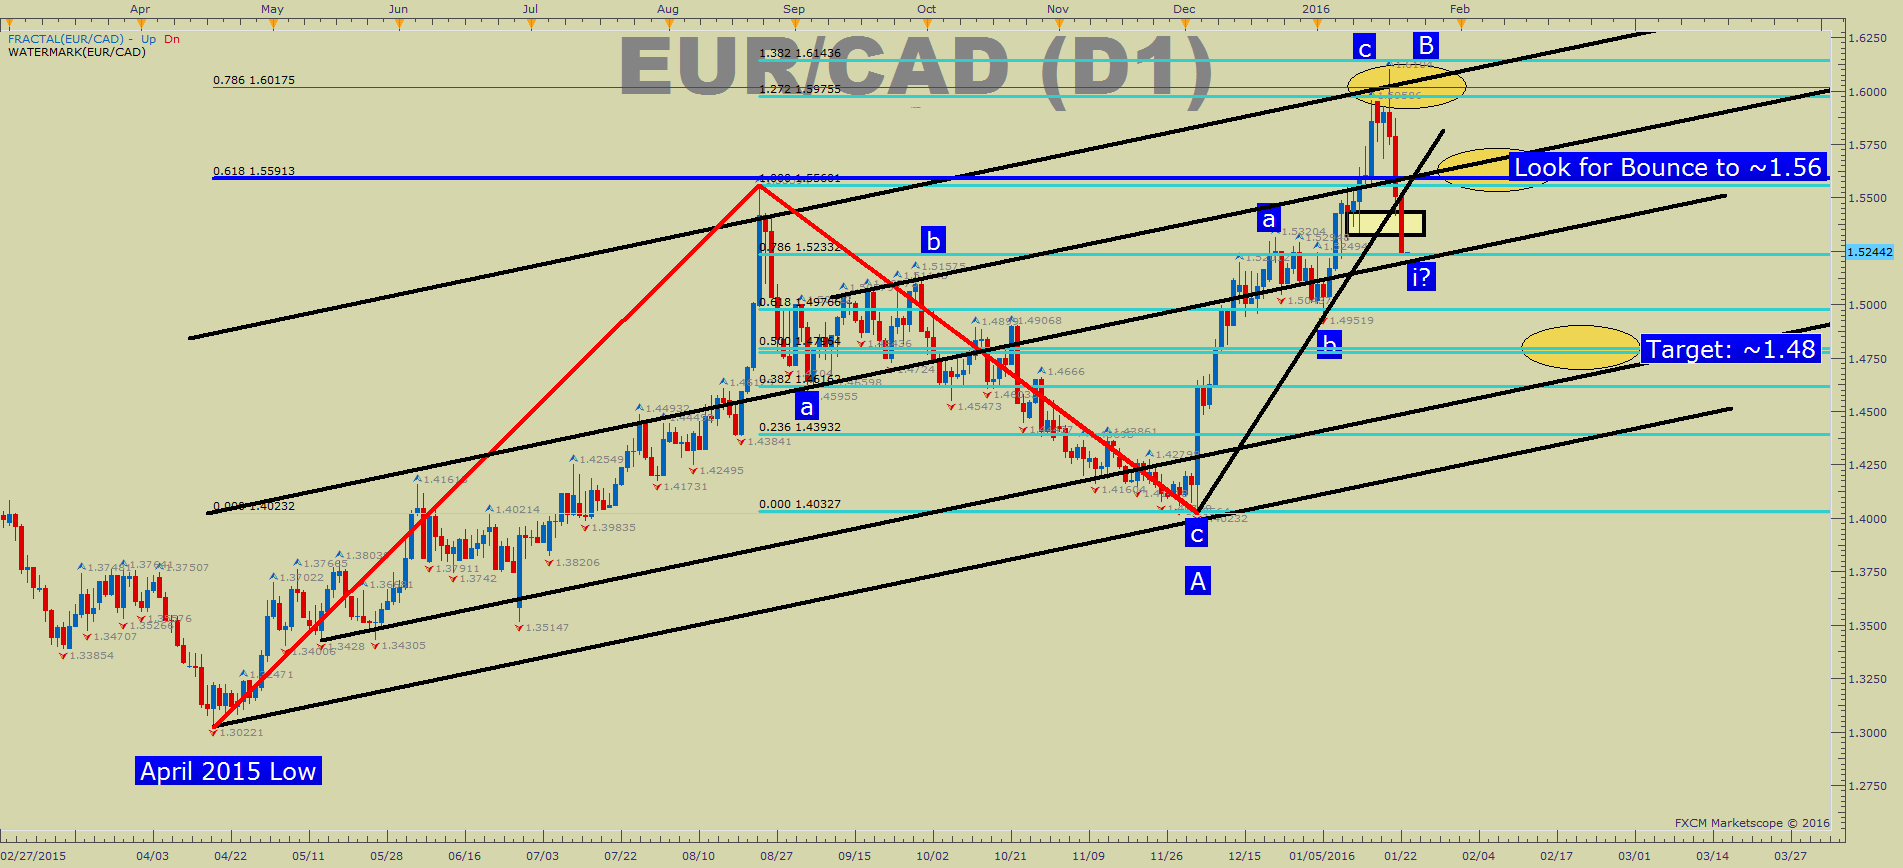
One last technical note is the initial move from Channel Resistance. The initial move lower has been aggressive as markets unwound shorts on CAD after the Bank of Canada Rate Announcement, digest the ECB rate announcement, and saw the highly correlated WTI Crude Oil contract see its strongest 2-day rally since 2008. A corrective move higher should be expected, but this is where we can get a taste for the probable next big move. The price channel takes a line drawn from the extremes since April 2015. That channel is also showing that price may have run out of steam on the topside, and that’s the technical bet being made in today’s analyst pick to go short EURCAD at a better levels. An internal trendline has been drawn as well off recent extremes within the channel, and that channel also indicates levels we could be looking to sell.
Key Technical Levels:
EUR/CAD – Price Channel Favors Selling Fibonacci Resistance with Good Risk: Reward toward Channel Lows
Second resistance: 1.5875 January 21 Lower-High
First resistance: 1.5515 Prior Impulsive Decline Start
Spot: 1.5381
First support: 1.5240 Jan. 22 Low
Second support: 1.4950 Late-December Support
Trade Setup:
I am looking to sell EURCAD should price retrace toward the common Fibonacci Retracement zone of 38.2-61.8% of the prior move. I will be looking for a further fall in price toward the bottom of the large price channel drawn expecting momentum to soon turn lower to break below key support. A daily close below 1.5240, the January 22 Low would help validate the Trade setup, and our attention would be turned to the two targets mentioned above. The protective stop will be at 1.5775, right above the 61.8% retracement level of the initial 860+-pip decline. This target aligns with a favorable risk: reward ratio that our Traits of Successful Traders report found to be one of the best things a trader can do to ensure long-term sustainability in your trading.


