GBP/USD Technical Outlook
- GBP/USD turning lower from confluent resistance
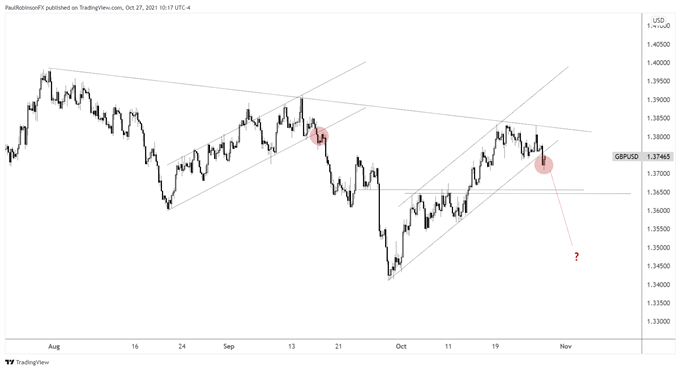
- Channel support on 4-hr chart has been breached


GBP/USD Charts Suggest Weakness if Ceiling Stays in Place
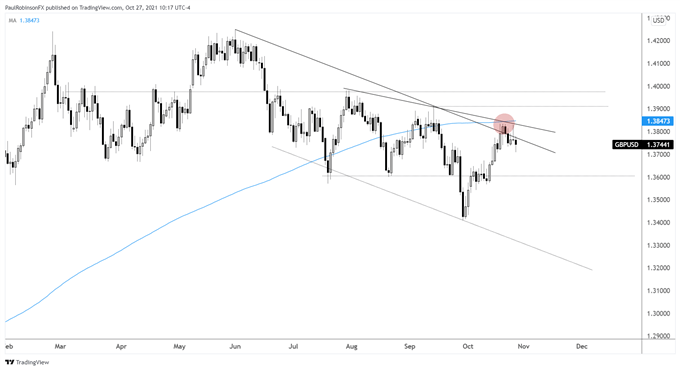
Cable has been unable to climb above confluent resistance (200-day/trend-lines) for over a week. As long as this ceiling remains in place then the outlook is neutral at best, likely bearish with other technical signposts supporting the case for selling. Yesterday, GBP/USD tried to break on through but ended up posting a bearish reversal candle.
Today we are seeing the upward channel off the September low get snapped. While still remaining relatively close to the underside trend-line, if price can’t regain broken support very soon then look for a dive lower to unfold in the days ahead.
There is minor support around 13650, but the larger area of interest lies around the 13575/13600 area, where several bounces occurred from July through September. How price behaves there could be telling should we see this support come into play.
To turn the outlook brighter, GBP/USD needs to rally and close on a daily basis above 13850 to clear the recent peaks and 200-day moving average. Even then, there will be levels to contend with but certainly the bearish tilt we are seeing now will be undermined significantly.


GBP/USD Daily Chart

GBP/USD 4-hr Chart

Resources for Forex Traders
Whether you are a new or experienced trader, we have several resources available to help you; indicator for tracking trader sentiment, quarterly trading forecasts, analytical and educational webinars held daily, trading guides to help you improve trading performance, and one specifically for those who are new to forex.
---Written by Paul Robinson, Market Analyst
You can follow Paul on Twitter at @PaulRobinsonFX


