


GBP/USD Technical Outlook
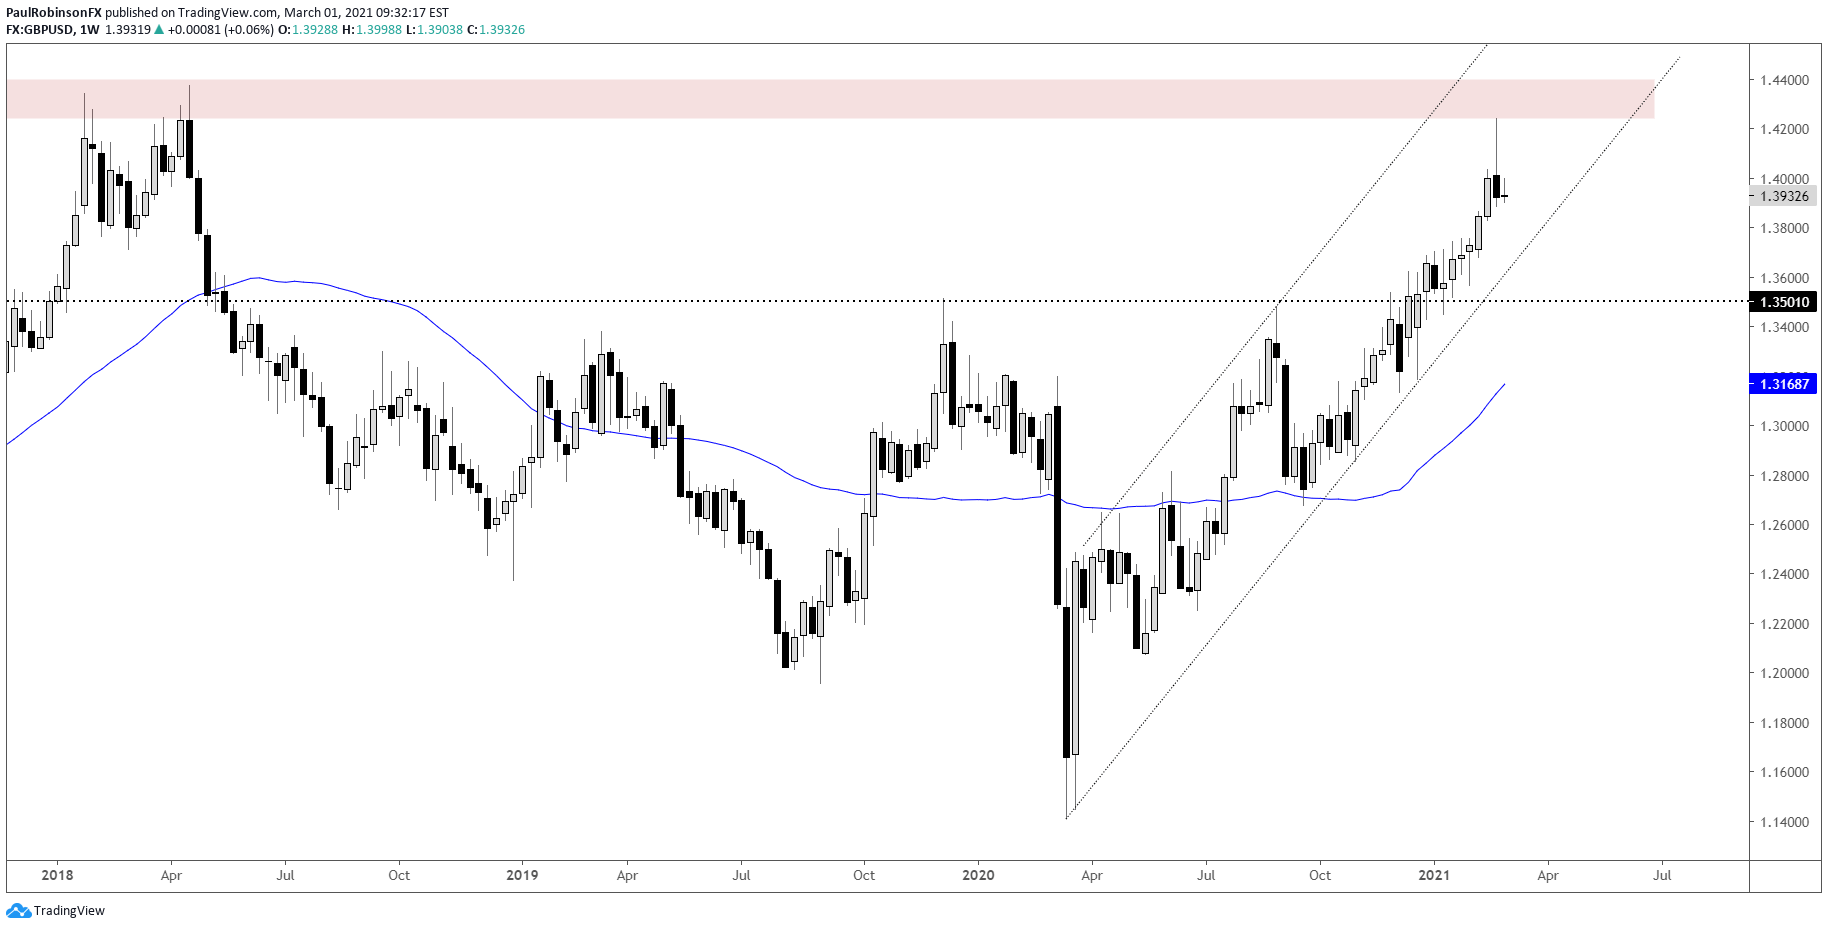
- GBP/USD posted weekly reversal at 2018 highs
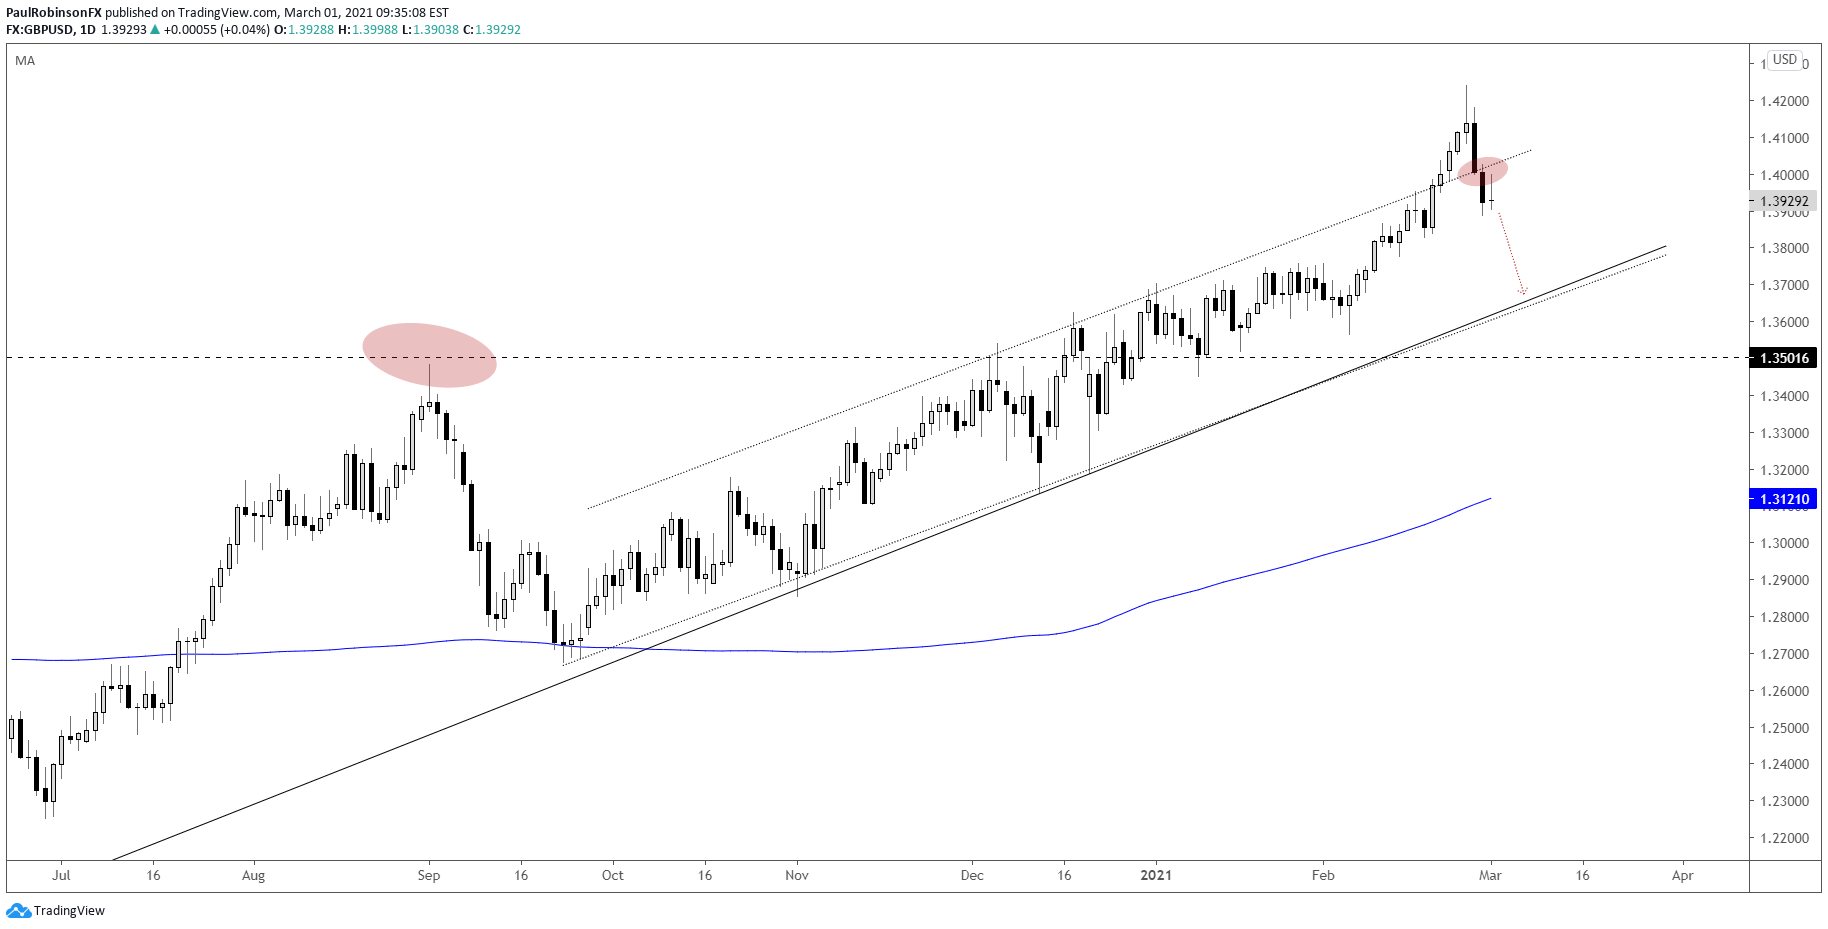
- Targeting support below 13700 near-term
GBP/USD to trade lower
Last week, GBP/USD posted a weekly reversal candle at an important long-term level. The high price of the candle was just a few pips above the strongest weekly close of 2018; an important macro high as it subsequently led to the lowest levels in decades.
The key reversal week at long-term resistance is reason enough to look for near-term weakness, but furthering the case is the break back inside the intermediate-term channel dating to September.
Often times when price leaves the confines of a channel it leads to a blow-off (this time to the 2018 high), and when that move is reversed back inside the channel the tendency is for a decline to develop to at least the other side of the channel. The other side of the channel is also in confluence with the March trend-line.
From a tactical standpoint a close back above the channel (~14050 and rising with the channel) would dent a bearish trading bias. On the downside, there is currently about 300 pips of room until the lower parallel of the channel is met around the 13635 level (and rising). This makes a for a decent risk/reward scenario.

GBP/USD Weekly Chart (weekly reversal around 2018 high)
GBP/USD Daily Chart (looking for other side of channel)
Resources for Forex Traders
Whether you are a new or experienced trader, we have several resources available to help you; indicator for tracking trader sentiment, quarterly trading forecasts, analytical and educational webinars held daily, trading guides to help you improve trading performance, and one specifically for those who are new to forex.
---Written by Paul Robinson, Market Analyst
You can follow Paul on Twitter at @PaulRobinsonFX


