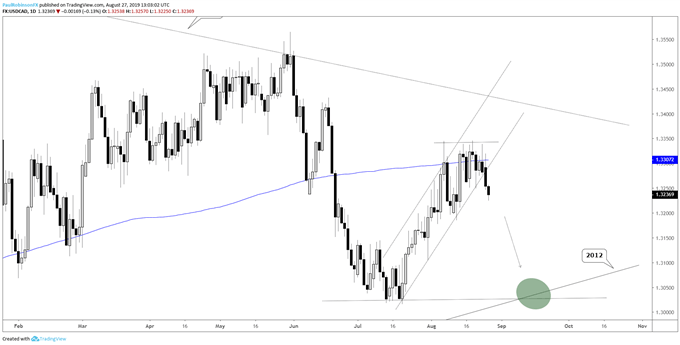
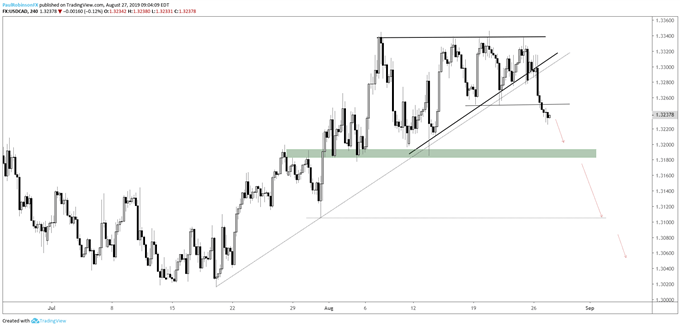
USDCAD had been guided higher for the past few weeks by an upward sloping channel, but as of yesterday that has been snapped with the breaking of not only the lower parallel of the channel, but also a breakout of a wedge formation.
The break of the 4-hr wedge has the downside in focus, especially with lower low from August 21 taking shape overnight. As long as USDCAD doesn’t reverse the breakdown, looking for the 2012, July low area near 13030ish. There will likely be some bumps along the way, but the trading bias for now is decisively towards lower prices.
Support levels to watch along the way include ~13180 and 13105 before arriving at what will be considered a major long-term test. The 2012 trend-line has been in play on several occasions since late 2017. Should USDCAD reach that point we will delve into what could happen next…
Trading Forecasts and Educational Guides for traders of all experience levels can be found on the DailyFX Trading Guides page.
USDCAD Daily Chart (channel snapped)

USDCAD 4-hr chart (wedge broken)

***Updates will be provided on these ideas and others in the trading/technical outlook webinars held at 930 GMT on Tuesday and Friday. If you are looking for ideas and feedback on how to improve your overall approach to trading, join me on Thursday each week for the Becoming a Better Trader webinar series.
Resources for Forex & CFD Traders
Whether you are a new or experienced trader, we have several resources available to help you; indicator for tracking trader sentiment, quarterly trading forecasts, analytical and educational webinars held daily, trading guides to help you improve trading performance, and one specifically for those who are new to forex.
---Written by Paul Robinson, Market Analyst
You can follow Paul on Twitter at @PaulRobinsonFX


