EUR/GBP Price, Charts and Analysis:
- Rally off the mid-February low looks exhausted.
- 200-dma now blocking further upside.
EUR/GBP Turning Lower as Resistance Stands Firm
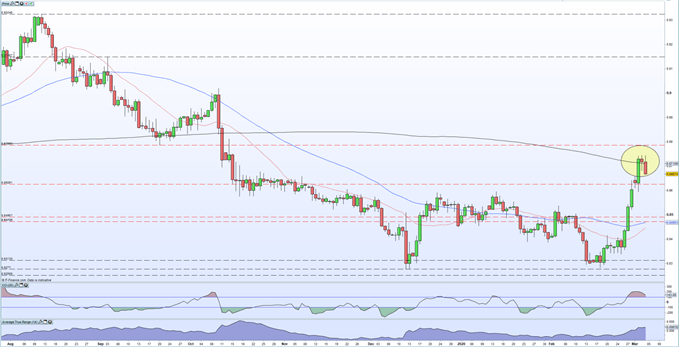
The recent strength of the Euro against a weak Sterling has propelled EUR/GBPnearly 5 big figures higher off its multi-week low print at 0.8282. The single currency has found willing buyers in the last month against a wide-section of currencies but this bullish momentum looks to fading this week. The daily chart below shows that while the pair have broken above the 200-day moving average, the move has lacked conviction and is now likely to act as short-term resistance. The chart also shows that the pair remain in overbought territory – using CCI – but have turned lower, indicating a degree of buyer exhaustion.
If resistance remains firm – and it may still be re-tested - the pair may look at a further pull-back to the 0.8600 level, followed by 0.8543. A convincing break above the 200-dma may see bullish momentum resume.
200-Day Moving Average: What is it and How it Works


EUR/GBP Daily Price Chart (August – March 4, 2020)

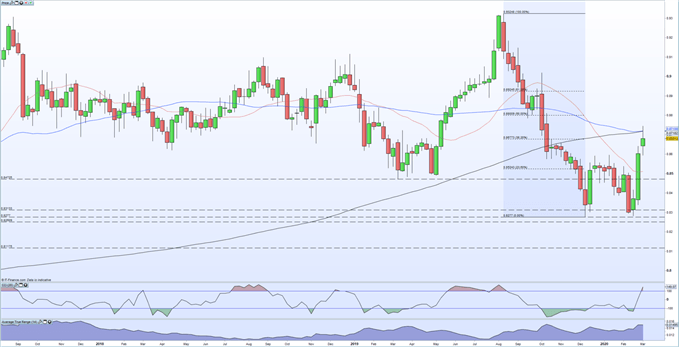
If we look at a weekly chart, a bearish ‘death cross’ is being formed – 50-dma going below the 200-dma – while the CCI indicator also shows the pair as overbought. The cross suggests lower prices going forward. A look at Fibonacci retracement of the recent move shows the next level of support at 0.8524, the 23.6% retracement level.
Trading Forex and Indices with Fibonacci Retracements
Weekly EUR/GBP Price Chart (August 2017 – March 4, 2020)

Traders may be interested in two of our trading guides – Traits of Successful Traders and Top Trading Lessons – while technical analysts are likely to be interested in our latest Elliott Wave Guide.
What is your view on Sterling (GBP) and the Euro – bullish or bearish?? You can let us know via the form at the end of this piece or you can contact the author via Twitter @nickcawley1.


