


Check out our new Trading Guides: they’re free and have been updated for the third quarter of 2018
USDJPY Retail Trade Data show 54.7% of traders are net-long the pair.
USDJPY Breaking to the Upside
We look to go long USDJPY on a one- to three-day time frame with positive technical indicators flashing on both the daily and four-hour charts.
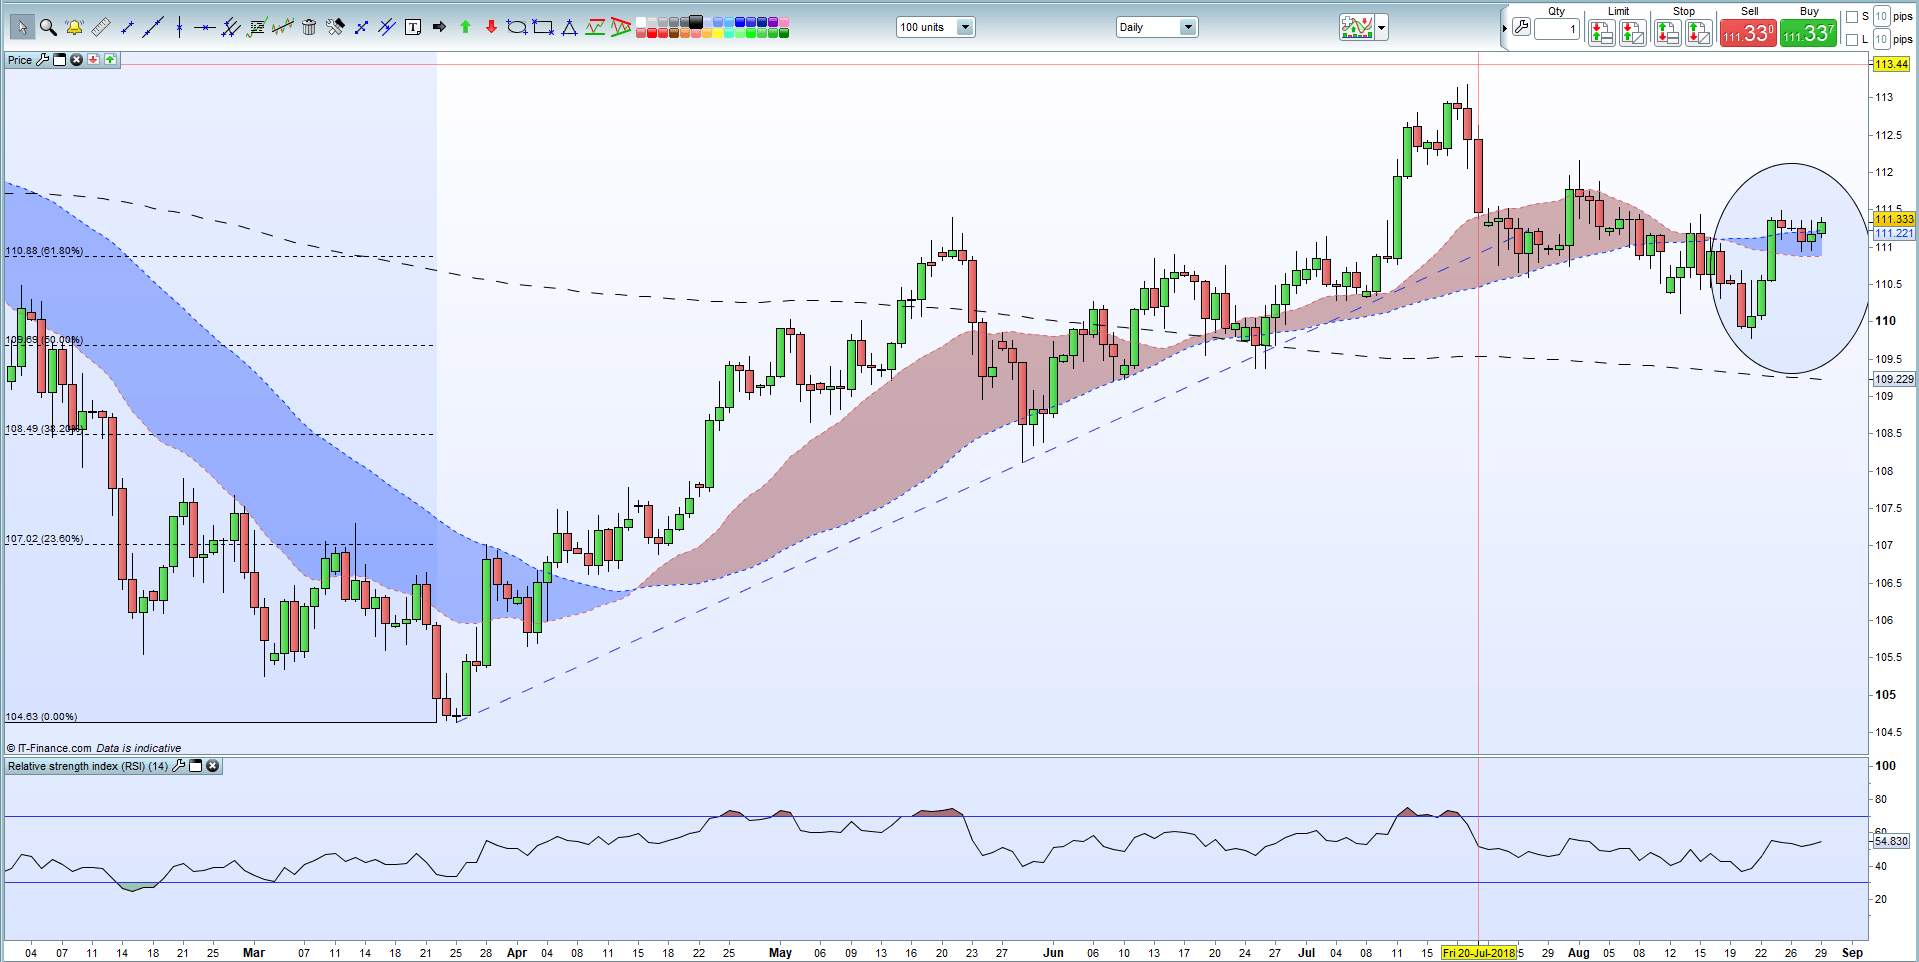
The daily chart shows a bullish flag formation (circled) from the August 21 low at 109.775 with a break above 111.49, the Friday August 24 high, opening the way to the July 19 high at 113.178. Downside protection is provided by the 61.8%
Fibonacci retracement at 110.88, the same level as the 20-day moving average. In addition, USDJPY trades above the 50-day ma at 111.220 and the 200-day ma at 109.228.
The length of the bull flags poll – roughly 1.75 points - would leave an upward breakout targeting around 113.25 which corresponds with the July 19 high at 113.178.
Chart: USDJPY Daily Price Chart (February – August 29, 2018)
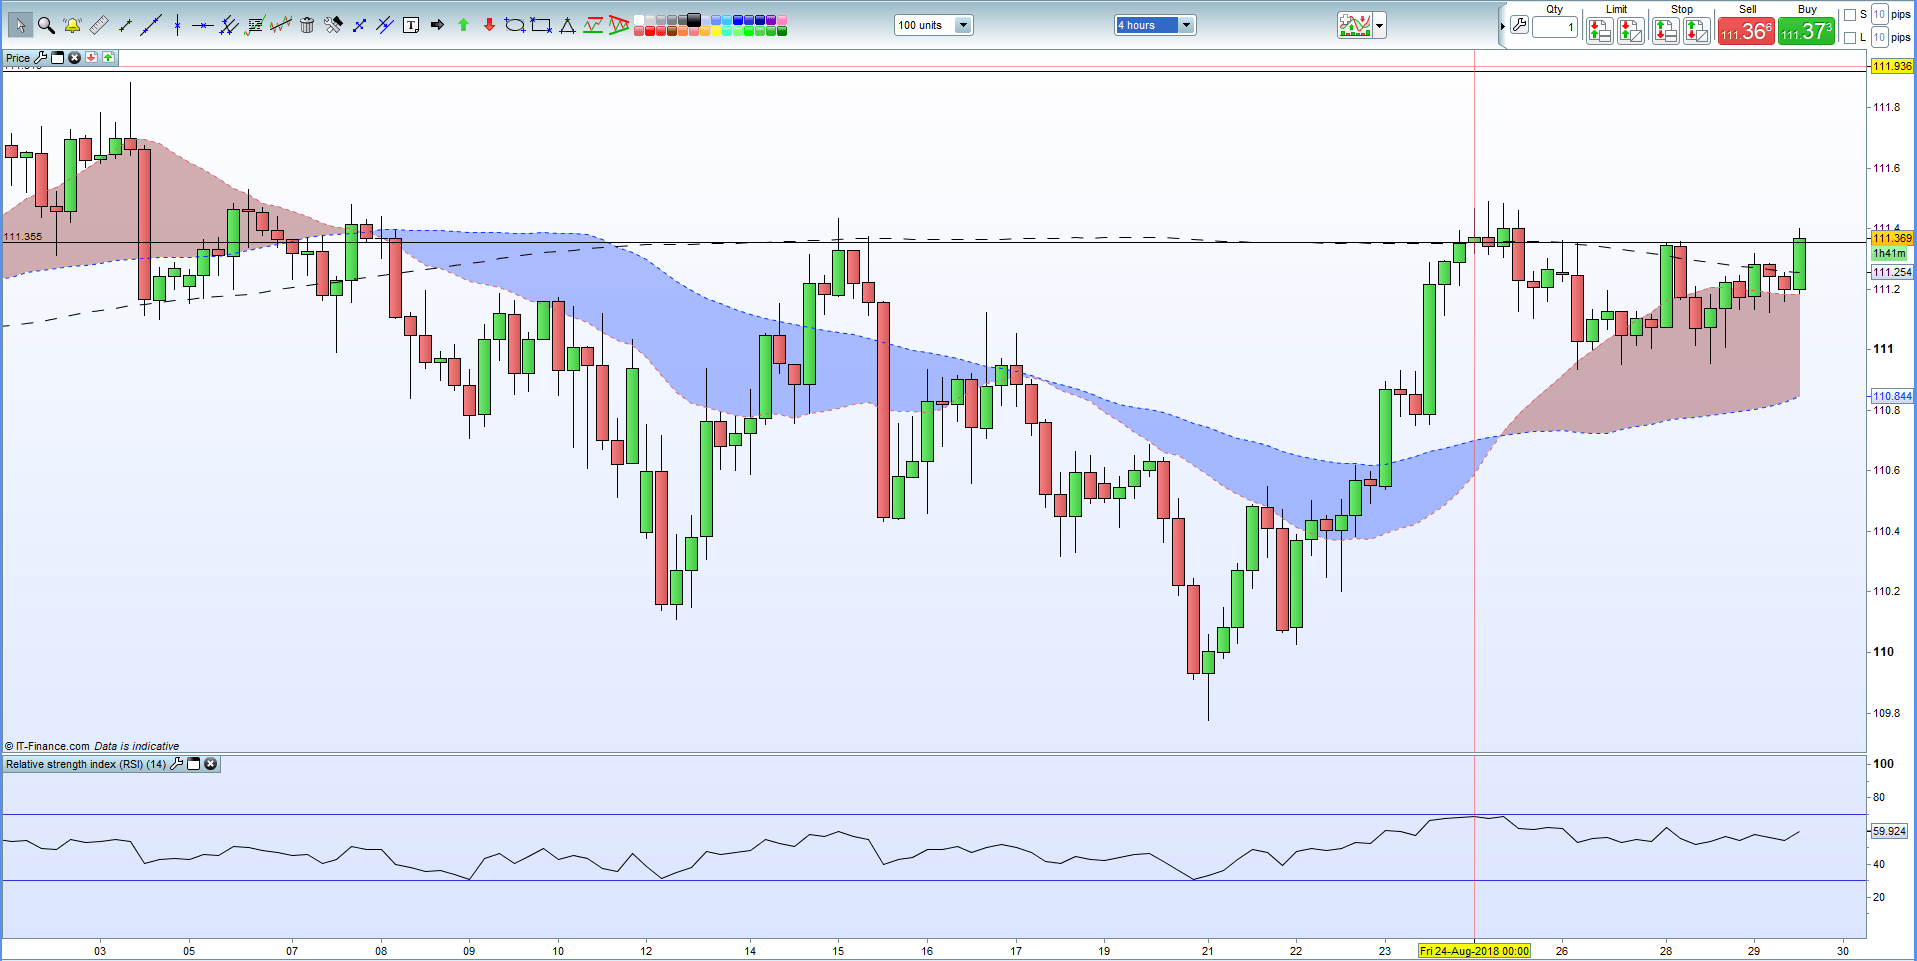
On the four-hour chart the fragile resistance at 111.490 is visible which would leave the pair looking at the August 1 high at 112.158 before the previously mentioned July 19 high print. Short-term support kicks-in between 109.220 and 109.250.
Chart: USDJPY Four-Hour Price Chart (August 1 – August 29, 2018)
We will place a tight stop on this short-term trade and will remove 40% of the position at target 1 and the remaining 60% at target 2. We will then move our stop-loss up to our entry level.
Entry Point: 111.320 (current market price)
Target 1: 112.158 (August 1 high)
Target 2: 113.178 (July 19 high)
Stop-Loss: 110.880 (61.8% Fibonacci retracement)
--- Written by Nick Cawley, Analyst
To contact Nick, email him at nicholas.cawley@ig.com
Follow Nick on Twitter @nickcawley1


