Check out our New Trading Guides: they’re free and have been updated for the third quarter of 2018 and include detailed analysis of USD and JPY.
- USDJPY uptrend remains strong with only trade war fears likely to break the trend.
- US interest rates are moving higher and the USD is soaring.
IG Client Sentiment Data can help you make more informed trading decisions, including our updated data on USDJPY.
We look to enter a long USDJPY position on any minor set-back and benefit from the continued uptrend in the pair. The US Dollar continues to strengthen due to ongoing monetary tightening with resistance levels in the USD currently proving no barrier to higher prices. The interest-rate sensitive US Treasury 2-year currently offers a near decade high 2.625% and over 2.75 percentage points more than the comparable Japanese government bond. This differential – and it is expected to widen further in the weeks ahead - will continue to draw money from Japan into the US, boosting the value of the greenback.
While we are bullish on USDJPY we are taking a slightly cautious approach to the trade – and we may well miss it completely – as the pairs recent rally may be trimmed if the market turns risk-off on any trade war escalation. Next week’s economic calendar is light for both currencies and should not affect the pair until ((Japanese inflation is released late Thursday July 26)) ahead of US Q2 GDP at 12:30 GMT on Friday July 27.
*** Amendment - Japanese National inflation is released at 23:30 GMT on Thursday July 19 and Tokyo inflation is released at 23:30 GMT on Thursday July 26 ***
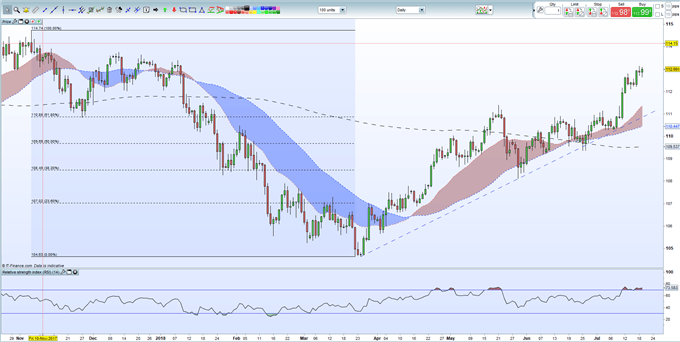
The chart below shows the uptrend from the March 25 is strong and supportive, while the pair trade above all three moving averages. The RSI indicator does show USDJPY in overbought territory, another reason why we have built a buffer in the trade. There is little in the way of resistance ahead of 114.74, the November 6, 2017 high, before we head back to the late December 2016/early January 2017 double top around 118.50. On hitting our first price target we would then move our stop-loss - set at 110.80 - up to our entry price, guaranteeing a booked profit and a free run at our second price target.
USDJPY Daily Price Chart (October 2017 – July 19, 2018)

Entry Point: 112.20
Target 1: 114.74 – November 6, 2017 high.
Target 2: 118.50 – Just below December 12, 2016 high.
Stop-Loss: 110.80 – Just below 61.8% Fibonacci retracement.
You may like to look at our Free Trading Guides which include Building Confidence in Trading, the Number One Mistake Traders Make and Top Trading Lessons.
--- Written by Nick Cawley, Analyst
To contact Nick, email him at nicholas.cawley@ig.com
Follow Nick on Twitter @nickcawley1
https://www.dailyfx.com/sentiment?ref-author=Cawley


