


Check out our new Trading Guides: they’re free and have been updated for the first quarter of 2018
*** UPDATE***
We entered into a long GBP/CAD position on January 18 this year at 1.72830 with two targets at 1.76600 and 1.78450.
***We have hit our first objective and sold half of the position at 1.76600 ***
We have now moved up our stop-loss for the balance of the trade to 1.75300 from 1.68760and continue to look towards the May 2017 high of 1.78450 as our target for the balance of our position.
GBP/CAD Price Chart Daily Time Frame (April 2017 – February 8, 2018).

*** Original Story – January 18, 2018 ***
GBP/CAD Rally has Further to Run
The Bank of Canada raised interest rates by 0.25% to 1.25% on Wednesday on the back of ultra-low unemployment – the lowest level in over 50 years – and a buoyant economy. The central bank’s governor Stephen Poloz however warned that ongoing North American Free Trade Agreement (NAFTA) negotiations with its neighbour the United States may stymy any further rate hikes especially “if an announcement is made that NAFTA is no longer to be.”
Recent price action showed that the rate hike was fully priced in and post-rate hike GBP/CAD rallied further in classic ‘sell the rumour, buy the fact’ fashion., hitting a one-month high. In addition, GBP is currently in the middle of a strong uptick as investors continue to price in a ‘softer’ Brexit on the back of a more conciliatory tone from the European Union on future trade agreements.
A look at the weekly chart shows three resistance levels nearing. The first target on the upside is the double top at 1.7470, made on November 30-31, before the 38.2% Fibonacci retracement level of the August 2015 – October 2016 move at 1.76590 comes into play. And just after that target, the May 2017 high around 1.78450 heaves into view. The stochastic indicator also points to continued GBP/CAD strength, adding another bullish layer to the trade.
Chart: GBPCAD Price Chart Weekly Timeframe (February 2015 – January 18, 2018)
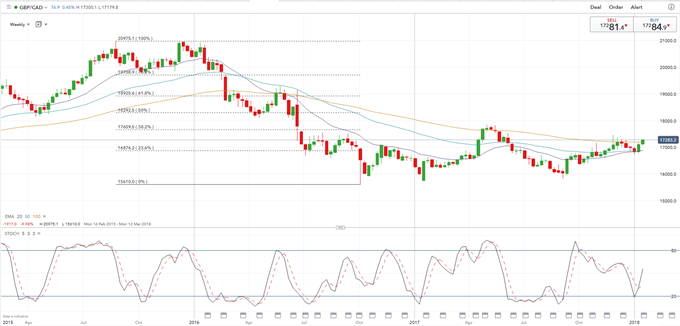
Entry Point: 1.72830 – Current Market Price.
Target 1: 1.7660 – 38.2% Fibonacci Retracement.
Target 2: 1.78450 – May 2017 High.
Stop-Loss: 1.6876 – 23.6% Fibonacci Retracement.
--- Written by Nick Cawley, Analyst
To contact Nick, email him at nicholas.cawley@ig.com
Follow Nick on Twitter @nickcawley1


