


- Updated levels on trade setup we’ve been tracking in Aussie (AUD/USD) & Sterling (GBP/USD)
- Join Michael for Live Weekly Strategy Webinars on Mondays on DailyFX at 12:30 GMT (8:30am ET)
- Check out our 2018 projections in our Free DailyFX GBP/USD Trading Forecasts
Review this week’s Strategy Webinar for an in-depth breakdown of this setup and more.
AUD/USD 120min Price Chart
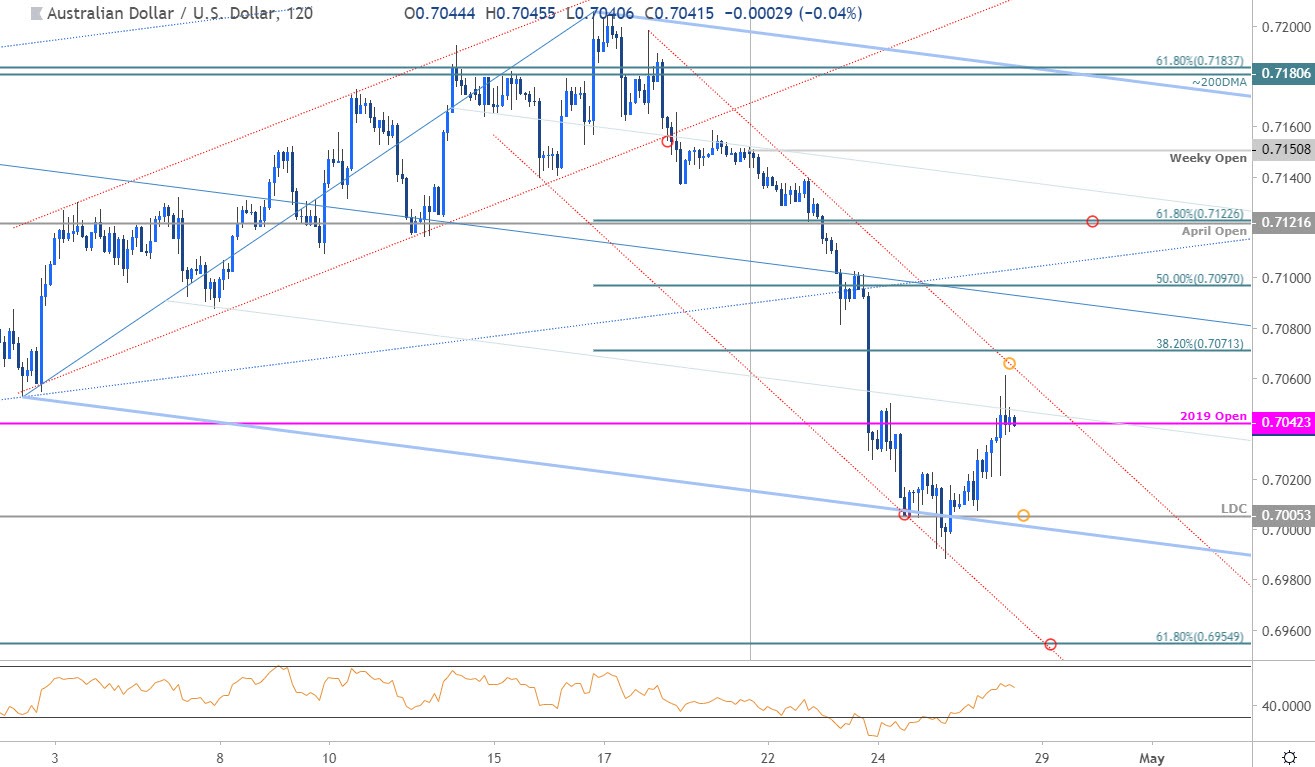
In my most recent AUD/USD Price Outlook we noted that a break below key support in Aussie had price “approaching initial areas of support that could offer a near-term reprieve. From a trading standpoint, look to reduce short-exposure / lower protective stops on a test of the 70-handle...” Price briefly registered an intraday low at 6988 before recovering into the close.
Look for a break of this near-term descending channel formation for guidance with a topside breach targeting 7071 backed by 7097 - key resistance / broader bearish invalidation stands at the monthly open / 61.8% retracement at 7122. A close below 70 exposes subsequent support objectives at the 6955.Review my latest AUD/USD Weekly Price Outlook for a look at the longer-term technical trade levels.
For a complete breakdown of Michael’s trading strategy, review his Foundations of Technical Analysis series on Building a Trading Strategy
GBP/USD Daily Price Chart

In this week’s Sterling Price Outlook, we noted that GBP/USD was testing, “BIG slope support here and leaves the immediate short-bias vulnerable while above today’s low.” That low held into the close of the week with price failing to mark a daily close below. The immediate short-bias remains at risk while above this threshold with near-term resistance eyed at the 100/200-day moving averages at 1.2960 and the 61.8% retracement at 1.30- both areas of interest for possible price exhaustion / short-entries IF reached. Ultimately, a break of the lows would keep the focus on key Fibonacci support at 1.2788/98. Review my latest GBP/USD Weekly Price Outlook for a look at the longer-term technical trade levels.
GBP/USD Trader Sentiment

- A summary of IG Client Sentiment shows traders are net-long GBP/USD- the ratio stands at +2.8 (73.7% of traders are long) – bearishreading
- Traders have remained net-long since March 26th; price has moved 2.1% lower since then
- Long positions are5.0% lower than yesterday and 9.7% lower from last week
- Short positions are4.4% lower than yesterday and 9.8% higher from last week
- We typically take a contrarian view to crowd sentiment, and the fact traders are net-long suggests Sterling prices may continue to fall. Yet traders are less net-long than yesterday & compared with last week and the recent changes in sentiment warn that the current GBP/USD price trend may soon reverse higher despite the fact traders remain net-long.
Find yourself getting trigger shy or missing opportunities? Learn how to build Confidence in Your Trading
New to Forex? Get started with our Beginners Trading Guide !
-Written by Michael Boutros, Currency Strategist with DailyFX
Follow Michaelon Twitter @MBForex
https://www.dailyfx.com/free_guide-tg.html?ref-author=Boutros


