


- Update on trade setup we’ve been tracking in EUR/USD, USD/JPY and USD/CHF
- Join Michael for Live Weekly Strategy Webinars on Mondays on DailyFX at 12:30 GMT (8:30ET)
- Check out our 2018 projections in our Free DailyFX Trading Forecasts
New to Forex? Get started with our Beginners Trading Guide !
EUR/USD Weekly Price Chart

We’ve been tracking this reversal in the EUR/USD since the start of the week with the rally failing yesterday at former slope support (now resistance) extending off the 2016 low. Interim support at 1.1510 backed by 1.1450 – both regions of interest for exhaustion / long-entries IF price is indeed heading higher. Resistance near-term still 1.1650/60. Intraday trading levels remain unchanged from this week’s EUR/USD Scalp Report.Review this week’s Strategy Webinar for an in-depth breakdown of this setup and more.
Learn the traits of a successful trader in our Free eBook!
USD/CHF 240 Price Chart
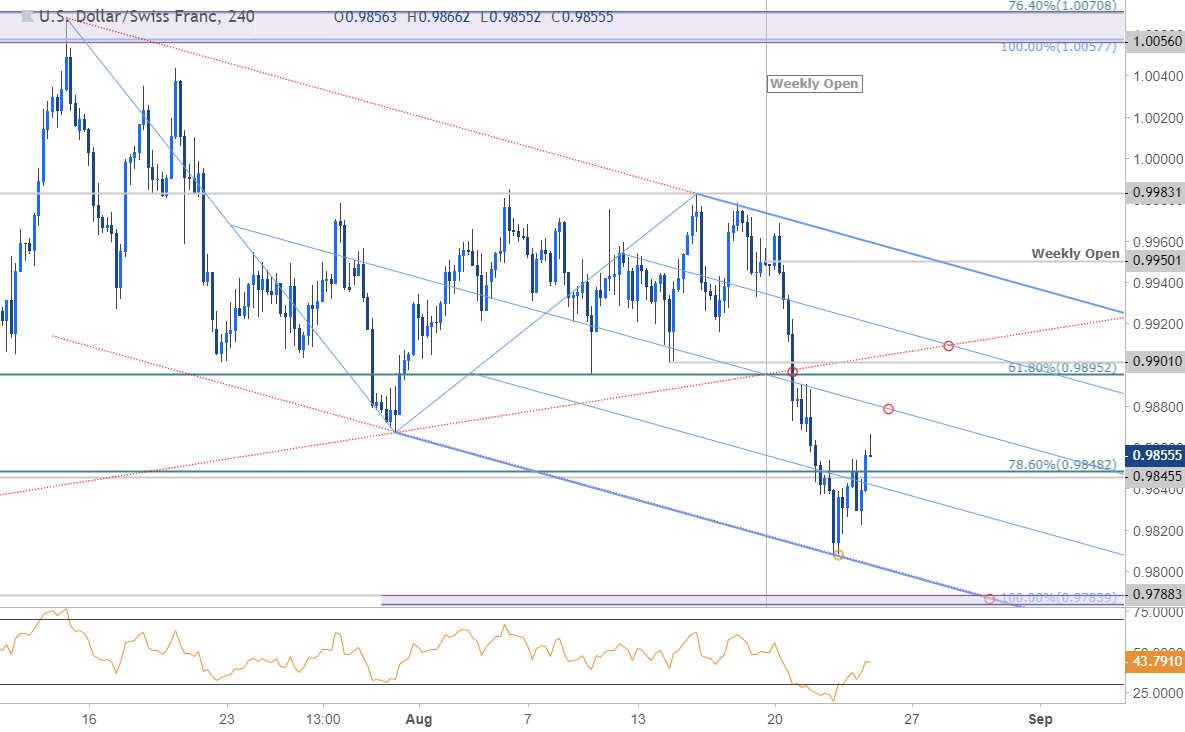
Last week we highlighted a well-defined monthly opening range in USD/CHF just above confluence support at 9890-9902. Our ‘Bottom line’ favored, “fading strength while within this zone until we get the definitive break’ with a break lower targeting 9846/50 backed by 9784/88- a region defined by the 100% extension and the June lows. Price rebounded off the lower parallel yesterday and IF the breakdown is legit, advances should be capped by the median-line around ~9880- looking for possible re-entry there. Bearish invalidation now at 9900.
For a complete breakdown of Michael’s trading strategy, review his Foundations of Technical Analysis series on Building a Trading Strategy
USD/JPY Weekly Price Chart
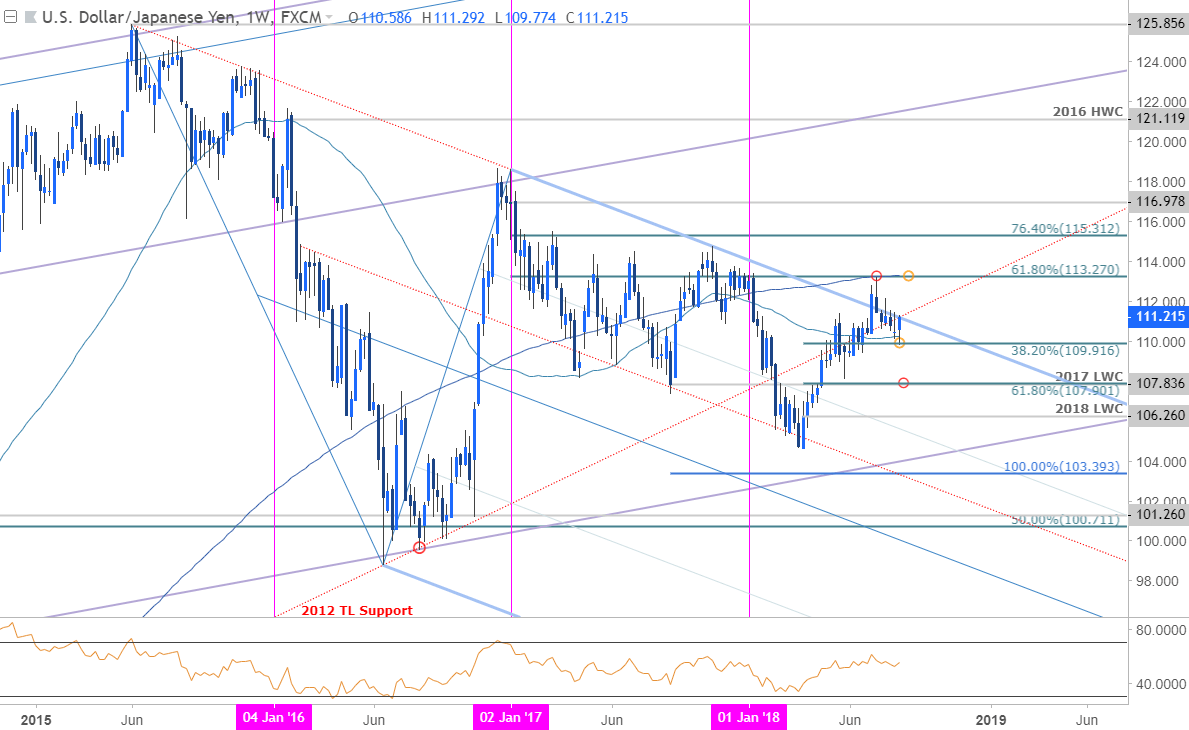
USD/JPY responded to a major support confluence this week at 109.91 with price now approaching the 2015 trendline resistance yet again. Keep an eye on the weekly close here with a breach /close above 111.48 needed to fuel the next leg higher. Intraday trading levels remain unchanged from this week’s USD/JPY Scalp Report.
Find yourself getting trigger shy or missing opportunities? Learn how to build Confidence in Your Trading
-Written by Michael Boutros, Currency Strategist with DailyFX
Follow Michaelon Twitter @MBForex or contact him at mboutros@dailyfx.com


