


EURJPY price, news and analysis:
- The EURJPY price is threatening to drop through a support line connecting the higher lows charted since mid-August.
- If the support breaks, further losses to the late-October and mid-August lows could follow.
EURJPY price under downward pressure
The EURJPY price is challenging a rising support line on the daily chart that has protected the downside since mid-August. If it breaks through, as seems increasingly likely, it could fall as far as the October 26 low at 126.63 and, if that breaks too, there is little further support ahead of the 124.90 low recorded on August 15.
EURJPY Price Chart, Daily Timeframe (July 16 – December 19, 2018)
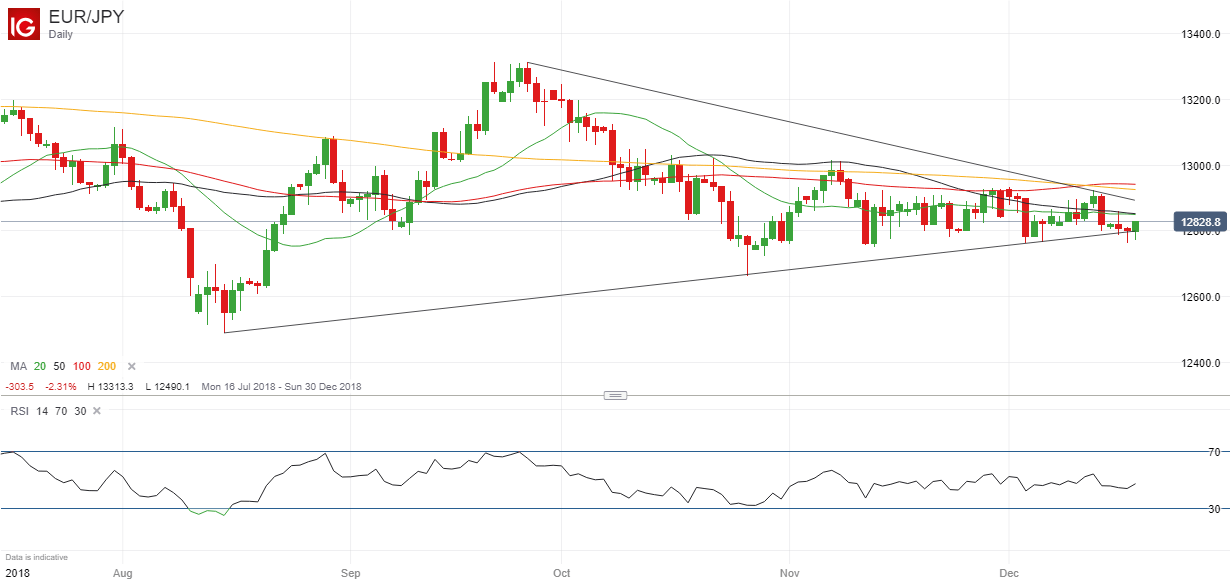
Chart by IG (You can click on it for a larger image)
The slide in EURJPY has come amid safe-haven demand for the Japanese Yen as trader sentiment has deteriorated. Moreover, there is plenty of resistance above the current price that could restrict gains if market confidence returns.
The 20-day moving average at 128.50, the 50-dma at 128.52, the 100-dma at 129.41 and the 200-dma at 129.26 are all protecting the upside, while there is further resistance at 128.93 from the falling line connecting the recent lower highs.
Note too that an analysis of retail trader positioning shows that the number of traders net-long has risen by 38.0% from last week and a contrarian view of crowd sentiment therefore supports the view that a decline is now possible.
Resources to help you trade the forex markets:
Whether you are a new or an experienced trader, at DailyFX we have many resources to help you:
- Analytical and educational webinars hosted several times per day,
- Trading guides to help you improve your trading performance,
- A guide specifically for those who are new to forex,
- And you can learn how to trade like an expert by reading our guide to the Traits of Successful Traders.
--- Written by Martin Essex, Analyst and Editor
Feel free to contact me via the comments section below, via email at martin.essex@ig.com or on Twitter @MartinSEssex


