


GBPUSD talking points:
- After touching a 2018 high of 1.4377 on April 17, GBPUSD has dropped back below the psychologically significant 1.40 level.
- Now those losses look set to be extended, with the February and March lows the initial targets.
Check out the IG Client Sentiment data to help you trade profitably.
And for a longer-term outlook download our Q2 forecast for GBP.
GBPUSD losses to persist
The outlook for GBPUSD is looking increasingly bleak after a drop from April 17’s 2018 high of 1.4377 to the current levels just below the 1.40 mark. Already under both the 20-day and 50-day moving averages, the pair has now fallen beneath the 100-day moving average too – confirming that the trend is now downwards.
The rot really began when the trendline that had supported GBPUSD for most of last month was broken on March 29. It then acted as resistance and after several attempts at an upside break the price fell sharply on April 18 and has continued to drop since.
GBPUSD Price Chart, Daily Timeframe (Year to Date)

Now the focus is on several important support levels, which are essentially the next medium-term targets. First up is the February 9 low at 1.3764, followed by the March 1 low at 1.3712. The long-term rising trendline that has supported the pair since March 14 last year is currently around the same level, at 1.3717, and below that lies the high from September 20 last year, at 1.3659.
Note too that while the 14-day relative strength index is approaching the 30 mark, that would indicate the market is oversold, it is not there yet.
Turning to the weekly chart below, note that last week was a key reversal week. GBPUSD hit a new high for the uptrend but closed under the previous week’s low – another bearish signal.
GBPUSD Price Chart, Weekly Timeframe (May 2016 to Date)
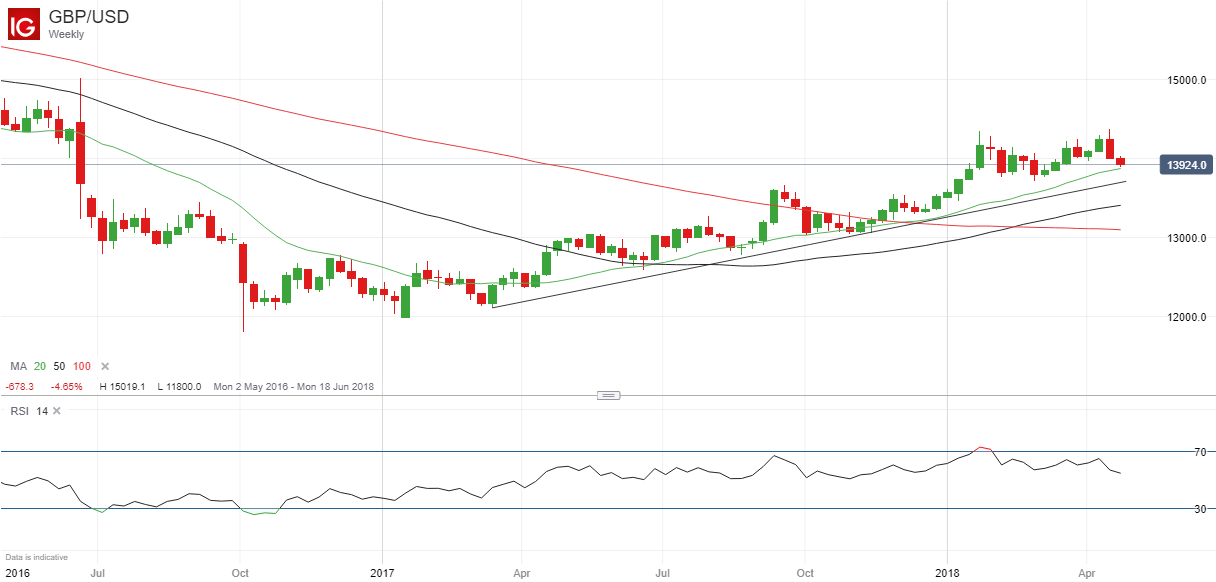
To the upside, the key risk to this scenario would be a rally back to the April 17 high at 1.4377, signaling a resumption of the uptrend.
Resources to help you trade the forex markets
Whether you are a new or an experienced trader, at DailyFX we have many resources to help you: analytical and educational webinars hosted several times per day, trading guides to help you improve your trading performance, and one specifically for those who are new to forex. You can learn how to trade like an expert by reading our guide to the Traits of Successful Traders.
--- Written by Martin Essex, Analyst and Editor
Feel free to contact me via the comments section below, via email at martin.essex@ig.com or on Twitter @MartinSEssex


