


GBPUSD talking points:
- GBPUSD is in a rising channel and a move towards the top of that channel is now possible.
- There is fundamental support for GBP too after a report that a solution to the post-Brexit Irish border problem is imminent.
Learn how to trade like an expert by reading our guide to the Traits of Successful Traders
Check out the top trading opportunities for 2018 on the DailyFX Trading Guides page
GBP could potentially move higher
GBPUSD has been a rising channel on the daily chart since the start of March and after two days of falls a move up to the resistance line marking the channel’s upper boundary now seems possible.
GBPUSD Price Chart, Daily Timeframe (January 19, 2018 – March 28, 2018)
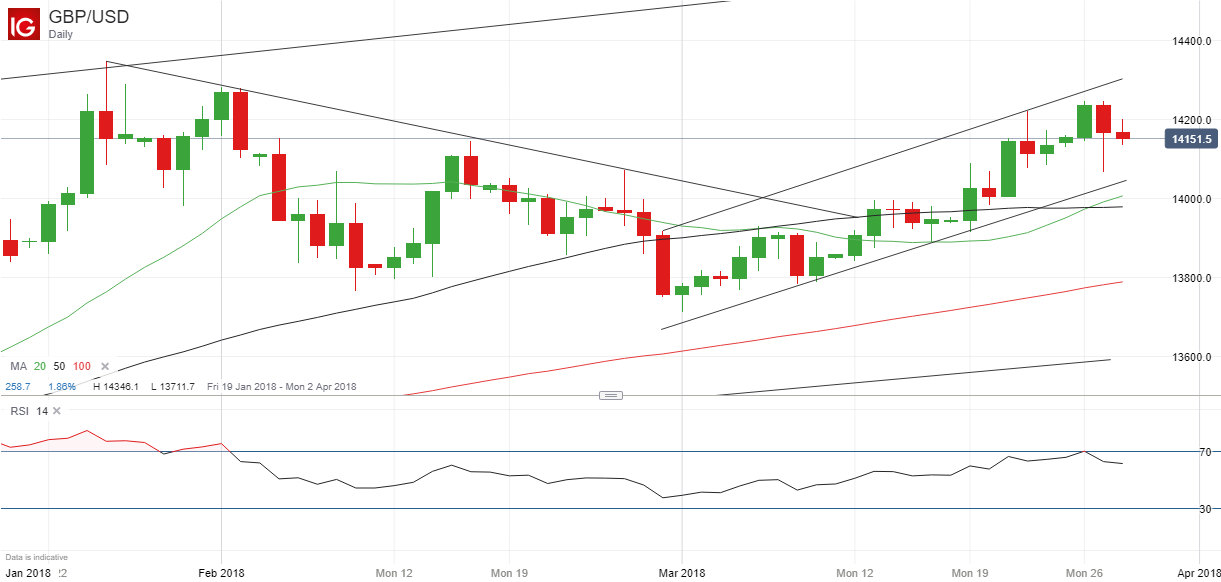
As the chart above shows, channel resistance now comes in at 1.43, approximately 1½ cents above the current GBPUSD level. Meanwhile, there is channel support at 1.4045 and then at the 20-day and 50-day moving averages.
The spur for the move higher could be a report in The Times newspaper that Irish officials have been told to expect new plans “imminently” from the UK on how it plans to avoid a post-Brexit hard border between the Republic of Ireland and Northern Ireland, which is part of the UK.
If that is confirmed, it would likely give GBP a boost as the border issue has been one of the principal Brexit problems and a solution has so far proved evasive.
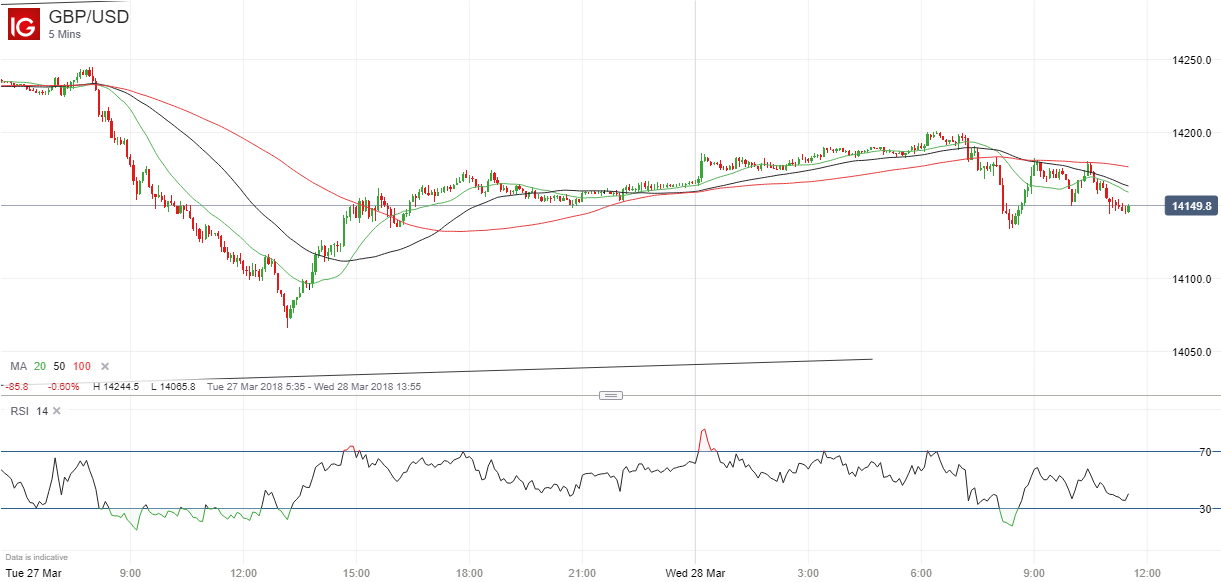
Note too that on the five-minute chart the relative strength index is approaching the 30 oversold level.
GBPUSD Price Chart, Five-Minute Timeframe (March 27, 2018 – March 28, 2018)
Resources to help you trade the forex markets
Whether you are a new or an experienced trader, at DailyFX we have many resources to help you: IG Client Sentiment data, analytical and educational webinars hosted several times per day, trading guides to help you improve your trading performance, and one specifically for those who are new to forex.
--- Written by Martin Essex, Analyst and Editor
Feel free to contact me via the comments section below, via email at martin.essex@ig.com or on Twitter @MartinSEssex


