


HANG SENG INDEX OUTLOOK: BULLISH
- The HSI underperformed global peers amid a technology crackdown and a slowing economy
- Easing property rules and lowering borrowing costs may boost market confidence
- The HSI breached above a “Falling Wedge” pattern, opening the door for further gains

Hong Kong’s Hang Seng Index (HSI) may be embracing a meaningful rebound after a prolonged period of consolidation. It was among the worst-performing indices globally last year, partly due to a severe technology crackdown and a slowing economy. While the S&P 500 index registered 17% gain over the past 12 months, the HSI fell over 18% (chart below). This might make the HSI attractive to value investors who are looking for a good bargain in the medium to long term.
The price-to-earnings (P/E) ratio of the HSI has fallen to 9.8, compared to 23.6 that of the S&P 500 index and 34.3 that of the Nasdaq 100 index. Its P/E ratio is also below the five-year average of 10.86. Relatively cheap valuation may cushion downside potential against external headwinds.
Hang Seng Index vs. S&P 500 Index – 12 Months Performance
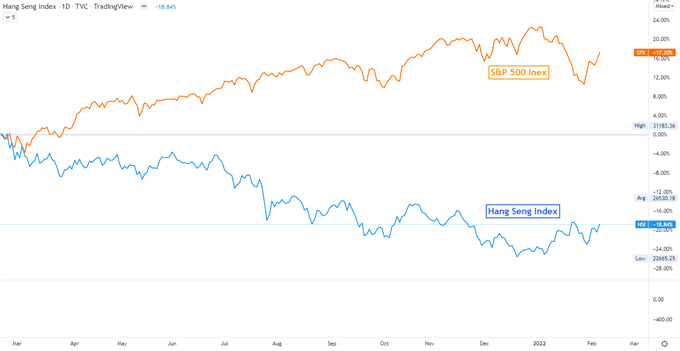
Chart created with TradingView
There are a couple of positive catalysts at the start of the year. Chinese authorities have drafted rules to allow property developers more access to escrow funds, providing crucial help for them to meet debt obligations. The relaxation of property rules ignited hopes that policymakers will also ease rules on the technology sector, alleviating pressures on stocks such as Tencent, Alibaba and Meituan. Their share prices have fallen sharply last year after authorities tightened the grip on tech firms, accusing them of monopoly practices. Alibaba has lost over 60% of its market value from its all-time highs, and the stock may be overly punished due to its strong fundamental and dominant position in China’s e-commerce market.
Besides, the PBOC has lowered borrowing costs for a second straight month in January, cutting the 1-year MLF rate by 10bps. This signaled that the world’s second-largest economy is entering into an easing monetary cycle as inflation in the country starts to cool and economic growth slows. Different from majority of the western countries that are tightening monetary policy to contain inflation, China is doing the opposite. Policy divergence makes Hong Kong stocks more attractive to global investors than before.
Top Constituents in the Hang Seng Index by Market Cap
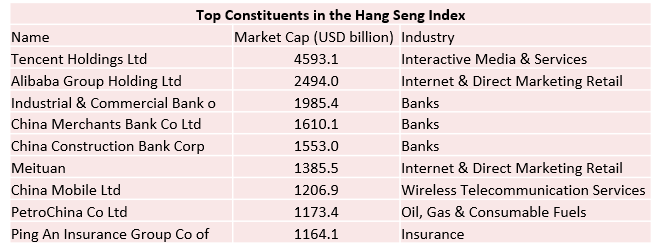
Source: Bloomberg, DailyFX
HANG SENT INDEX TECHNICAL ANALYSIS
The Hang Seng Index (HSI) breached above a “Falling Wedge” pattern from the upside, opening the door for further upside potential. The “Falling Wedge” is typically a bullish trend-reversal pattern, which paves the way for a strong technical rebound after a prolonged period of consolidation.
The index has also likely formed a “Double Bottom” chart pattern with strong support found at 22,800. The “Double Bottom” is also a common bullish trend-reversal pattern, suggesting that selling pressure may be depleting after prices touch the “bottom” twice.
An immediate resistance level can be found at around 24,900 – the 127.2% Fibonacci extension. Breaching above this level may expose the next resistance level of 25,600. The MACD indicator is trending higher above the neutral midpoint, underscoring bullish momentum.
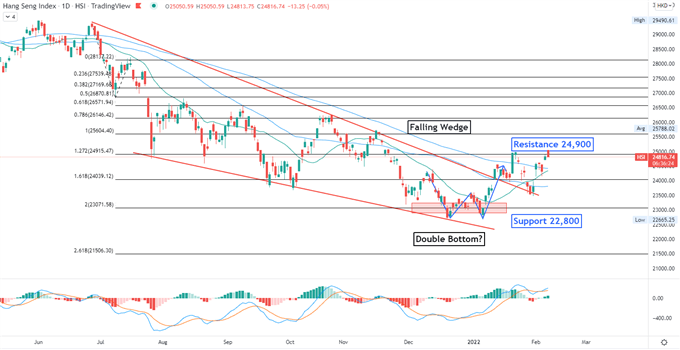
Chart created with TradingView
--- Written by Margaret Yang, Strategist for DailyFX.com
To contact Margaret, use the Comments section below or @margaretyjy on Twitter


