


We went long USD/JPY on Sept 22 on the dip down to 111.70. Now that USD/JPY is testing recent highs, we want to move forward the stop loss to lock in some gains. We will use the October 19 low as the current risk level and move the stop loss to 112.25.
The rest of the trading plan remains the same. Our first target to the upside is 115.50. At that point, we will close 1/3 of the position.
USD/JPY Daily Chart Analysis
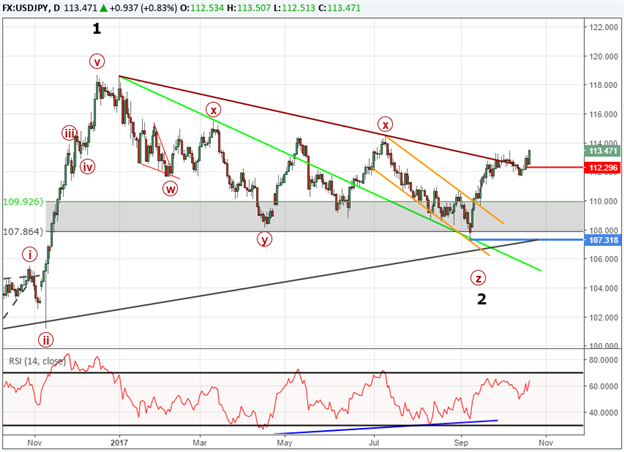
We continue to monitor the relationship between USD/JPY and Nikkei 225. However, if USD/JPY is unable to follow through on this week’s strength, then we will be happy to exit the full position at 112.25. We will allow the technical levels to guide us and the latest swing low on an intraday chart is the October 19 low at 112.29. Our stop loss will be just a couple pips below that level at 112.25.
IG Client Sentiment is favoring a higher USD/JPY exchange rate. The sentiment reading was near parity earlier this week. Now, with a reading of -1.2, this shift to a net short reading is providing us with a bullish signal. Follow the live sentiment reading here.
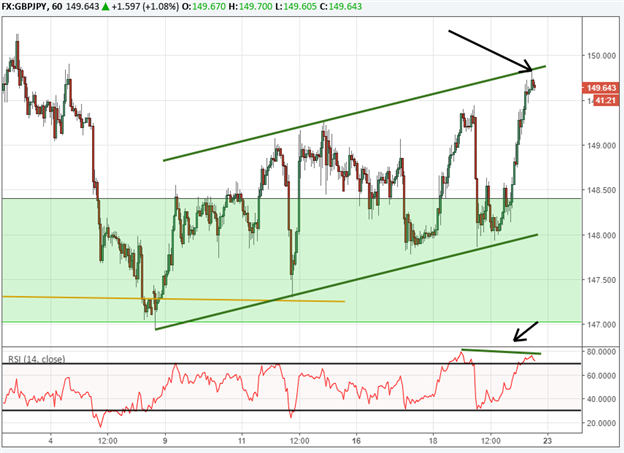
Another market I am watching in relation to USD/JPY is GBP/JPY. GBP/JPY is sitting near a potential reversal zone. If GBP/JPY ignores this price channel and shoots higher, that will likely support a higher USD/JPY exchange rate as well.
GBP/JPY Price Channel and Divergence
Do you know why many traders lose? Find out here.
If you are new to trading FX, we have created this guide just for you.
To learn more about Elliott Wave theory, grab the beginner and advanced trading guide.
---Written by Jeremy Wagner, CEWA-M
Jeremy is a Certified Elliott Wave analyst with a Master’s designation. This report is intended to illustrate how Elliott Wave Theory can be used to identify potential patterns of trading opportunities.
Jeremy’s favorite Elliott Wave Resources:
Elliott Wave Patterns: What is a Zigzag?
3 Elliott Wave Flat Patterns to Know and Understand
Learn more about the Elliott Wave patterns by receiving our beginner and advanced Elliott Wave guides.
Also, view these one-hour webinar recordings on the specific patterns:
Elliott Wave Impulse Patterns
Elliott Wave Zigzag Patterns
Elliott Wave Flat Patterns
Elliott Wave Triangle Patterns
Elliott Wave Diagonal Patterns
Starting Your Elliott Wave Counting
Follow on twitter @JWagnerFXTrader .
Join Jeremy’s distribution list.
Recent Elliott Wave articles by Jeremy:


