


On Friday, we wrote how it appears USDJPY and its advance may kick off a new uptrend. Now that price action has matured some more, confirmation is building that a longer term bottom may have formed for USD/JPY.
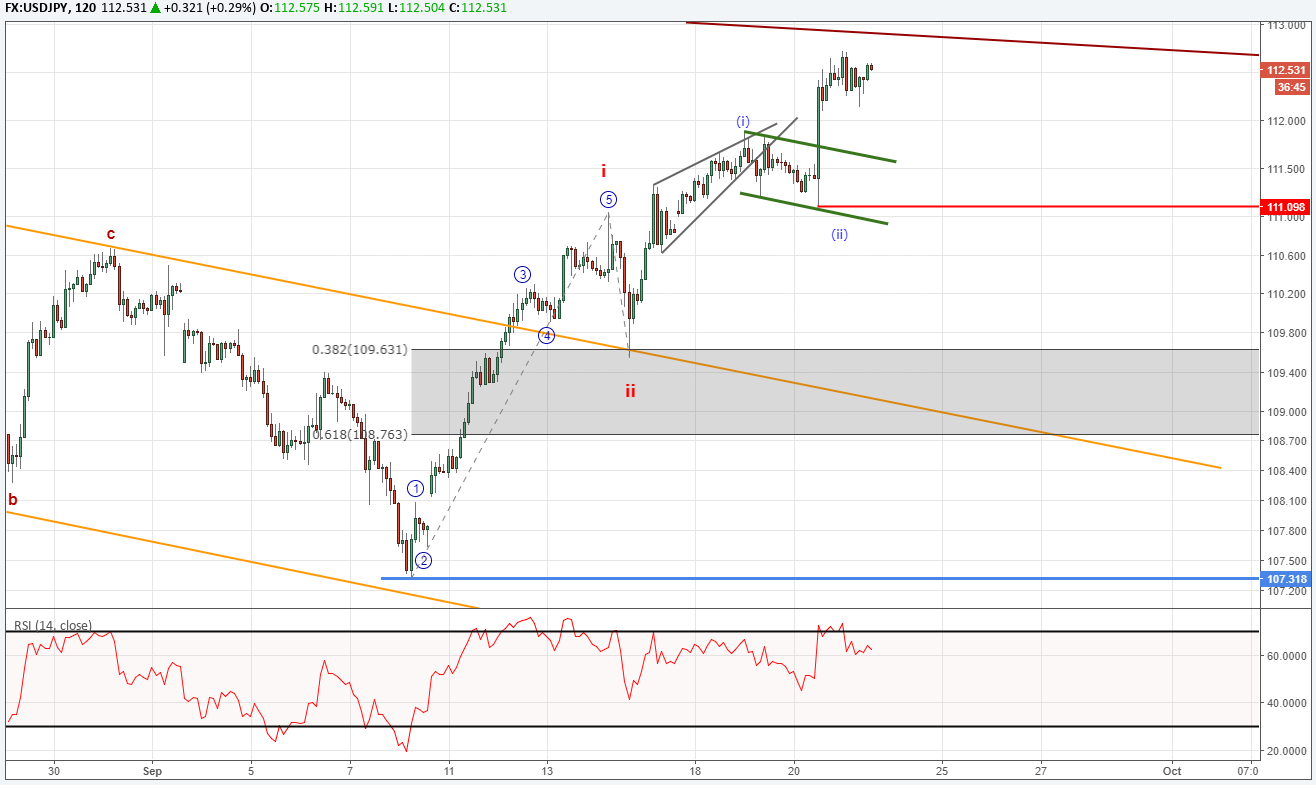
In addition to the impulse move to start a new trend, we have a brief correction and partial retracement to that trend on September 14. This is a 5-3 wave sequence that we commonly use to start counting with Elliott Wave.
The next big obstacle in the path of USD/JPY is the resistance trend line covering the January and July 2017 highs. This resistance line is crossing near 112.80. It is possible that prices may react lower near here. If USD/JPY does correct a bit, we will look to initiate a long position on the dip near 111.70.
For this wave picture to remain as labeled, USD/JPY will need to hold above 111.09. If USDJPY is successful in breaking above 112.80, then the next levels of resistance are 114.50, 115.50, and 118.67.
We think this move higher has the potential to test these resistance levels and possibly even higher ones including new highs above 126.
Bottom line, we are looking to enter long on a 112.80 break higher or on a dip to 111.70. The key level and initial risk can be set at 111.09. Our initial target level is 115.50 where we will exit 1/3 of the position. We will manually trail the remaining position while targeting higher levels.
See how positive risk to reward ratios can affect trader profitability. Read our Traits of Successful Traders research.
If you are new to trading FX, we have created this guide just for you.
To learn more about Elliott Wave theory, grab the beginner and advanced trading guide.
USD/JPY Start of New Uptrend?
---Written by Jeremy Wagner, CEWA-M
Jeremy is a Certified Elliott Wave analyst with a Master’s designation. This report is intended to illustrate how Elliott Wave Theory can be used to identify potential patterns of trading opportunities.
For further study on Elliott Wave, watch this on demand webinar recording on “Starting Your Elliott Wave Counting” where Jeremy uses the 5-3 pattern similar to the one noted above as a way to starting counts using EW. [Registration required]
Recent Elliott Wave articles by Jeremy:
GBP/USD Approaches Important Long Term Price Zone
Crude Oil and Natural Gas Prices Grind Higher
Gold Prices Dive 3 out of 4 Days
Follow on twitter @JWagnerFXTrader .
Join Jeremy’s distribution list.


