


The USD/CAD has sold off nearly 1,000 pips in the last 30 days while sentiment flirts with parity. The move leading up to the January 20 high was very steep and could be a blow off top. However, USD/CAD has yet to penetrate meaningful support levels on a day crude oil prices jump nearly 6% (at the time of this writing).
Failure of USD/CAD to push below support levels suggest the market isn’t quite ready to change its mood and that the short term top from January 20 might be vulnerable to a retest. Also, sentiment, as measured through Speculative Sentiment Index (SSI) has not meaningfully worked itself into positive territory.
(See real time trader positioning.)
Lastly, prices have converged to a technical point where we may get a reaction higher (more on that in a moment). Therefore, we have a good risk to reward ratio opportunity to the long side of USDCAD.
Market Interpretation
Market Condition: Retracement
Bias: Long USD/CAD
Entry: Near 1.3700
Stop Loss: Near 1.3450 (-250 pips)
First Target: Near 1.4200 (+500 pips)
Second Target: 1.4600 (+900 pips)
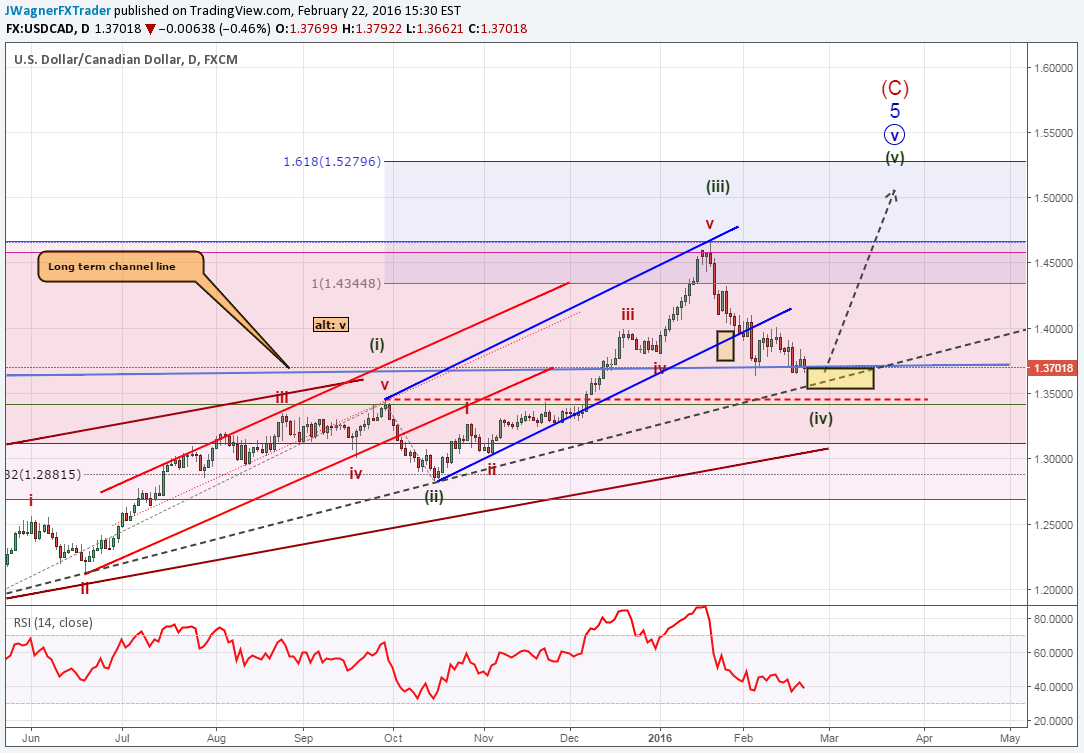
USD/CAD Chops Into Confluence of Support
[Image 1]
In the chart above, you’ll notice the blue long term channel line which, until December, has contained prices for the past 9 years (since 2007). Prices accelerated higher out of this channel and have now come back to retest the top side of the channel line.
In Elliott Wave terms, this current sell off could be a fourth wave labeled (iv) of an extended fifth wave. If so, then prices will need to hold above wave (i) at 1.3457 for another retest of the January 20 highs.
One last technical alert to point out. When connecting together the swing lows from May, June, October 2015, that trend line crosses near 1.3560. A break below this level would be an early warning signal that deeper losses may be on the horizon and this trade idea won’t work out.
The Canadian Dollar is strongly influenced by the oil markets while the value of the US Dollar is being influenced by the Fed’s rate projection. Read the quarterly forecast for crude oil, and the impact rates hikes (or lack thereof) may have on the US Dollar.
We’ve researched millions of trades and found that almost half of the traders (43%) turned a profit when implementing this simple technique that every trader has control over. Learn more about that tweak in pages 13-14 of the Traits of Successful Traders Guide [free registration].
To receive additional picks or articles on using Elliott Wave Theory, join Jeremy’s distribution list.


