There is a cluster of wave relationships in the USDCAD in the 1.27 handle. This increases the chance of prices consolidating and pushing lower. This sell off, if it transpires, may find support near 1.2600.
If prices barely hesitate and zip higher above 1.28, then that speaks to the underlying strength of the pair.
The trading plan is simple. Buy a break out above 1.2800 or buy a dip near 1.2600.
On a continued move above 1.2800, risk can be set below the swing low of 1.2670.
If a dip to 1.2600 transpires, risk can be set at 1.2421 (June 24 high).
The conservative target is 1.30. The next level target is 1.34.
There are patterns that speak to a deeper sell-off in the pair, but those are considered lower probability at this point. You can view alternate options on the chart below.
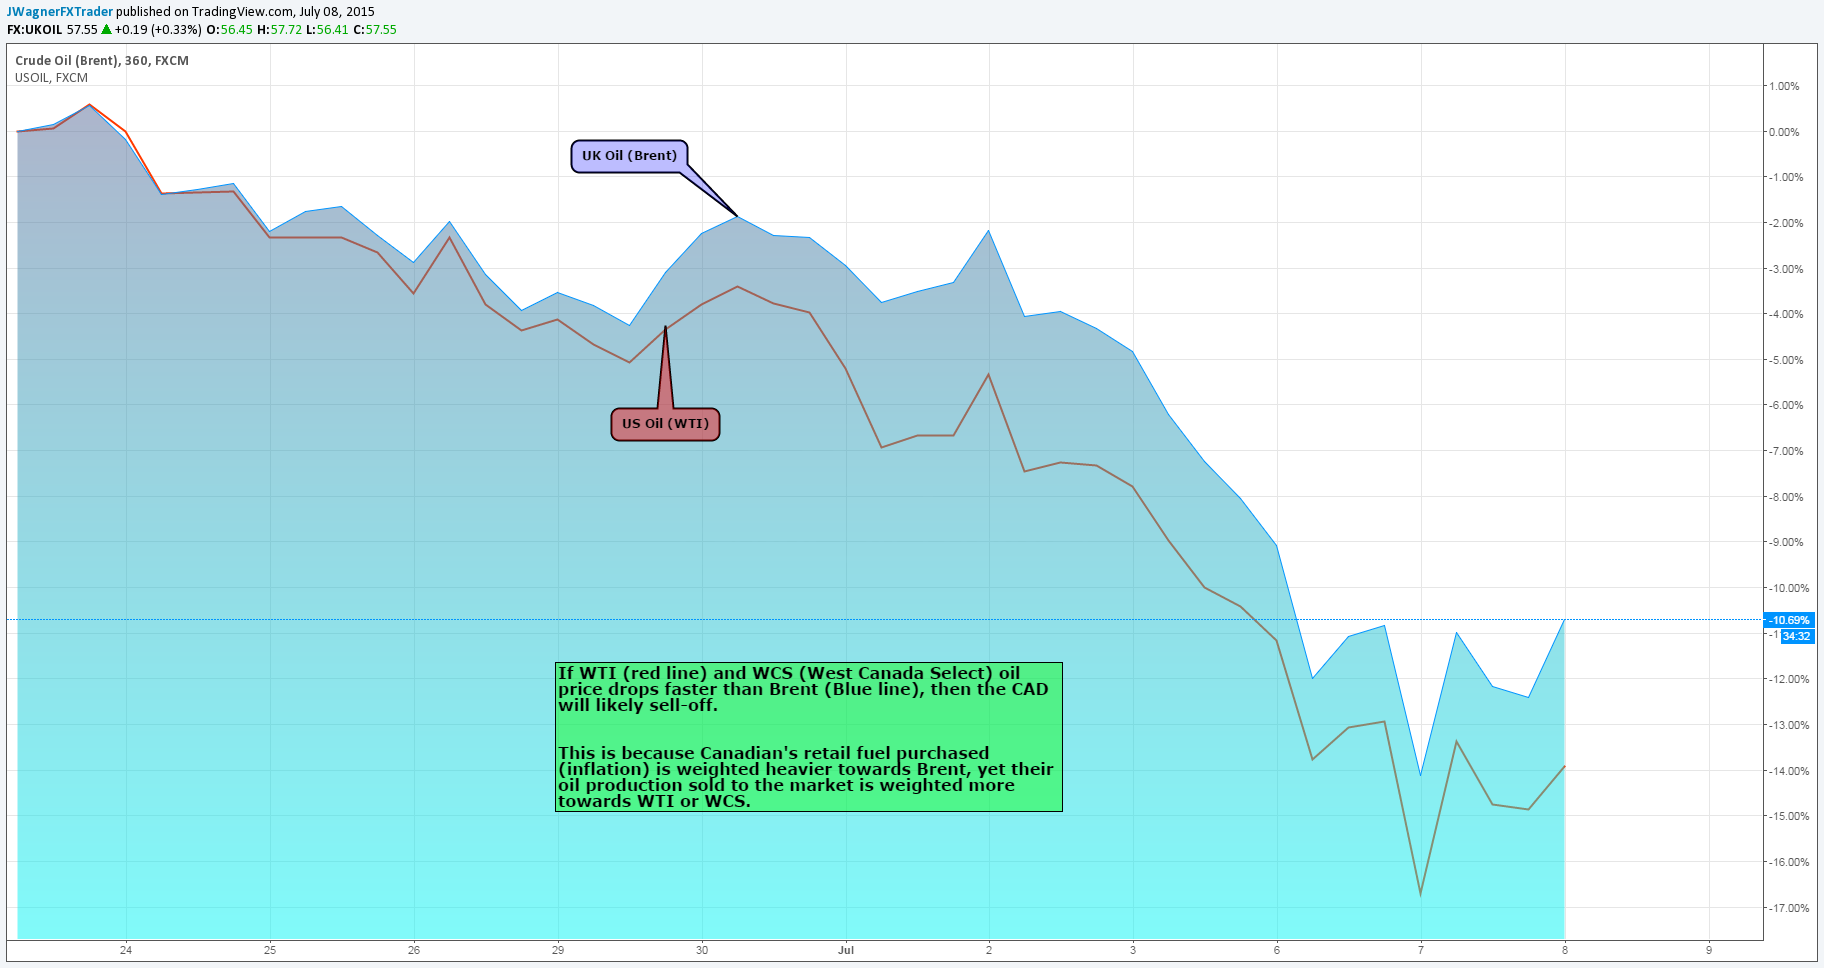
(Click on the chart below to zoom in, press the play button towards the right to set the market in motion since the post was made.)
Created using TradingView charts
To receive additional picks, sign up for Jeremy’s distribution list.
Another technical point to watch is the price changes of Brent Crude vs WTI Crude. Back in April 2015, the Bank of Canada released a statement itemizing this important difference. In essence, Canadian citizens purchase at the retail pump based on Brent. However, their producers sell oil into the market more heavily weighted towards WTI (and West Canada Select). If WTI pricing doesn’t outpace Brent pricing, CAD suffers.