Price Action Talking Points:
- Rates are in focus on the macro-front and this can continue to drive volatility into equities and FX markets. Below I look at price action in a few markets of interest around those themes.
- This Wednesday’s CPI release is the hot button on the economic calendar for this week, and that will likely have impact on rates.
- The analysis contained in article relies on price action and chart formations. To learn more about price action or chart patterns, check out our DailyFX Education section.


Rates are on the move in the US and given recent history, it looks like that volatility will be a workable medium for some time.
Markets have started to build in the expectation/hope that the Fed may be nearing a pivot. Powell said that we are at ‘the neutral rate’ at the last rate decision and this was widely-read to mean that the bank may be nearing a pause point on rate hikes. And given how some economic data had started to worsen, like the U of Michigan Consumer Sentiment reading in June printing right at 50 or CPI continuing to jump even with the Fed hiking, there was some possible supporting evidence for that narrative.
The NFP report from last Friday should have smashed those hopes. Sure, it was one report. But it was a massive one with +528k jobs added against an expectation for +250k. Perhaps more pertinent to the Fed’s fight against inflation, wage growth continued to jump, coming in at 5.2% versus 4.9%.
This is a big deal: The Fed had cited strength in the labor market, perhaps too much strength multiple times when hiking rates in the first-half of the year. That building expectation for a FOMC pause was also seemingly married to the expectation for data to continue to worsen, particularly on the job market. That clearly did not happen in the most recent NFP report and, again, it’s just one report but it’s going in the exact opposite direction of what the Fed wants.
Fed-Speak
Even going into NFP last week there was a building narrative around the Fed that markets were getting ahead of themselves in looking for a pivot. I take that from the fact that various Fed members said or alluded to the fact that ‘markets are getting ahead of themselves.’
Mary Daly of the San Fran Fed even went so far as to say that the bank was ‘nowhere near done’ with rate hikes, amongst a host of other, let’s say ‘interesting’ comments. Also opining on the matter was Neel Kashkari of Minneapolis, Charlie Evans of Chicago and Michelle Bowman of Kansas City, all pointing towards the possibility of a hawkish-Fed moving forward.
Rates started to reflect this impact last week, but as I discussed in last week’s webinar, that impact was uneven, with the short-end of the curve seeing a stronger gain than what showed on the longer-end of the curve. This spelled for more yield curve inversion, with last week marking the deepest inversion of two and ten year yields since August of 2000, right before the tech boom turned into the tech wreck.
US Treasury Yield Curve – 10/2 Year Treasury Yields
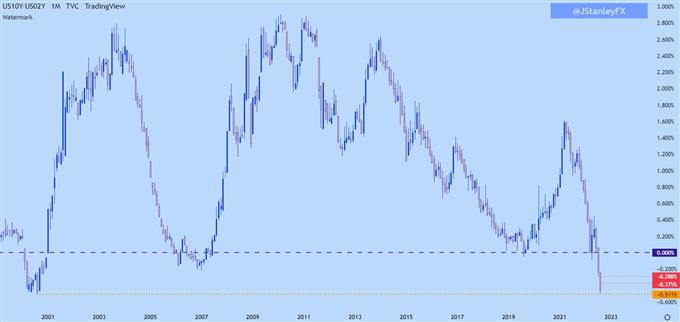
Chart prepared by James Stanley; produced with Tradingview
USD
If we’re looking at a theme around US rates, the US Dollar will likely be involved somewhere along the way. From the daily chart, the USD has held last week’s support test around the 50% mark of the recent major move, which is confluent with both the 105 psychological level and a prior spot of resistance-turned-support.
That candle last Tuesday was especially powerful – a bullish engulf with a wick touching right around that 105 level, with a low of 105.049, thereby confirming 105 as support with bulls showing a slightly higher-low.
US Dollar Daily Price Chart
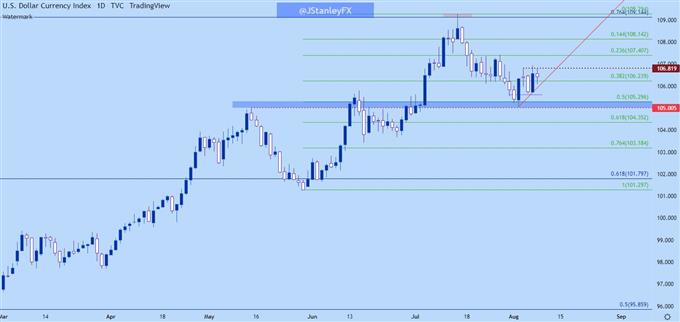
Chart prepared by James Stanley; USD, DXY on Tradingview
USD Shorter-Term
Shorter-term, the US Dollar is working on an ascending triangle. Resistance shows around 106.82 and there’s been a series of higher-lows that’s printed since that support test last week. This keeps the door open for bullish breakout potential on the basis of that formation.
As for next resistance – the Fibonacci retracement drawn from the May 31 low up to the July high has offered a number of inflection, and the 107.41 level sticks out. Notably, the 38.2% retracement from that same study is helping to set support after the 50% marker came into play last week.


US Dollar Four-Hour Price Chart
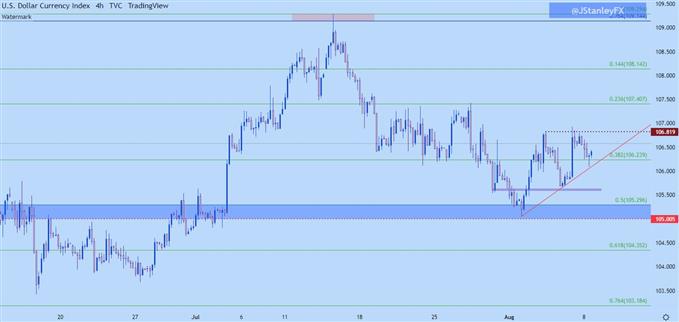
Chart prepared by James Stanley; USD, DXY on Tradingview
Yen
I looked into this on Wednesday but with rates in focus, the Yen remains an interesting variable on the FX-front, and the reason for this goes right back to Central Bank policy.
The BoJ went to negative rates in 2016. The design was to help keep the Yen weak while also encouraging investment. The results are, well, varied at this point but so far there’s been no signal of change out of the bank, and this has allowed the JPY to remain as a funding currency for carry trades.
When US rates are minimal and there’s little hope of change, that variable might not be of much use. But, when US rates begin to rise, so does interest in the carry trade. And as rates lift, so does the rollover or swap payment that can be had from the interest rate divergence between the two economies. This increases demand, which helps to boost price, and now we have a very symbiotic relationship as an increasing interest rate paradigm drives in a bullish trend.
This explains USD/JPY going back to September. I had even set my Top Trade for Q4 of last year on GBP/JPY with rates as a central reason. The Fed had started to highlight rate hike potential in 2022 at the September 2021 FOMC, and that theme has only grown from there.
More recently, however, as markets were building in the narrative that a pause may be near, those Yen trends began to turn-around. Last week saw USD/JPY falling with a full head of steam. But, it was on Tuesday, as some of Mary Daly’s comments began to come into markets that a shift began to show.
USD/JPY bounce by more than 500 pips from the Tuesday low up to the Friday high. Prices began re-testing a key area on the chart, plotted around the 135.00 psychological level, and that test has held into this week.


USD/JPY Daily Chart
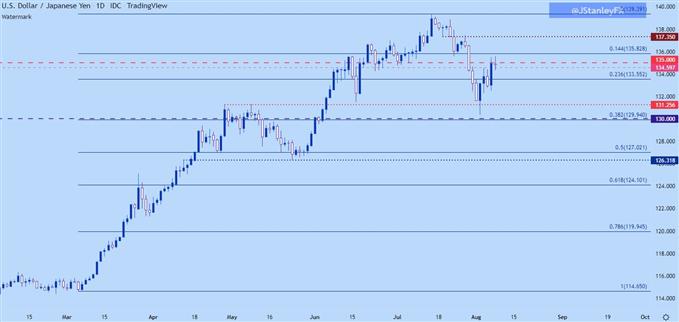
Chart prepared by James Stanley; USD/JPY on Tradingview
I had looked into the pair last Wednesday, highlighting a breakout formation with resistance around 134.60. That breakout hit and prices ran above 135.00, but there was a dearth of fresh bullish action above that level. There’s support potential around the 133.55 Fibonacci level for bullish continuation scenarios.
USD/JPY is of interest for higher rate scenarios. If we do see US rates continuing to gain, so does the attractiveness of carry for bullish USD/JPY scenarios, which can continue to drive the trend.


USD/JPY Four-Hour Price Chart
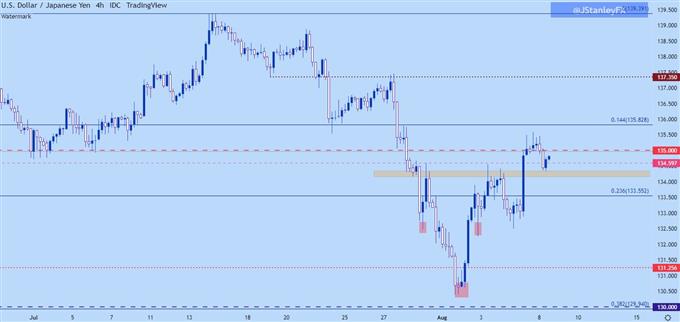
Chart prepared by James Stanley; USD/JPY on Tradingview
EUR/JPY
On the other side of the rates argument, for those expecting rates to continue to fall, EUR/JPY could be of interest. If we are seeing a reversal of Yen-weakness on the back of carry trade unwind, the Euro could be a vulnerable counterpart for such a theme.
The words ‘Euro’ and ‘strength’ probably haven’t been strung together in quite some time but, against the Yen, that’s been the theme since last Tuesday’s sharp reversal in the JPY.
EUR/JPY finds itself situated at an interesting spot on the chart. The level of 137.50 is a major psychological level and it helped to set a high back in March. It came through as resistance-turned-support a few months later and, more recently, it came in to hold the Friday high as it’s doing so far today.
This is also confluent with the 38.2% Fibonacci retracement of the recent sell-off.
EUR/JPY Daily Chart
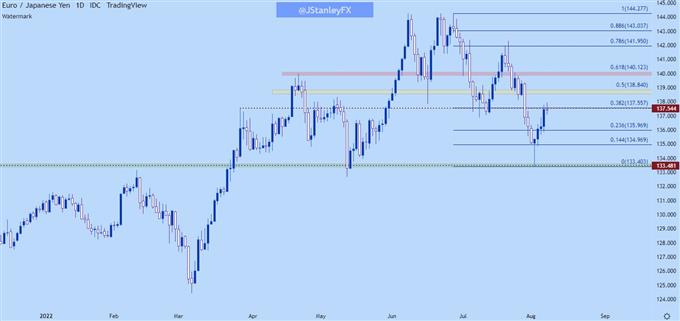
Chart prepared by James Stanley; EUR/JPY on Tradingview
S&P 500
Bear market bounces are fairly common in sell-offs, and the common culprit for that is sentiment.
If the picture is very bearish but anyone interested and wanting to sell already has – who is going to push prices down? There has to be action to create movements and if there’s no interested sellers at current levels, well, that market is prone to a squeeze. Prices moving higher wash out unrealized profits from open shorts, thereby compelling more shorts to close, creating more buying pressure.
Before you know it, we have a bounce, and that’s where contrarians can come into look for perceived value as a bullish move begins to show. And then the trend can grow and grow until, eventually, price moves to a point where sellers want to react to the degree that they offset that buying interest and then some.
And if that moment doesn’t happen – well we have a new bullish trend.
In stocks that’s been the backdrop of late as a deep oversold conditions in mid-June yielded to a strong pullback in US equities. And the degree with which that’s happened has helped to build the narrative around rates and the Fed and the possibility of the bottom already being in.
The question is whether we’re at that spot where sellers may come in to tip the scales back into bearish territory. In the S&P 500, prices built a doji at a key zone of resistance on the weekly chart last week.
S&P 500 Weekly Price Chart
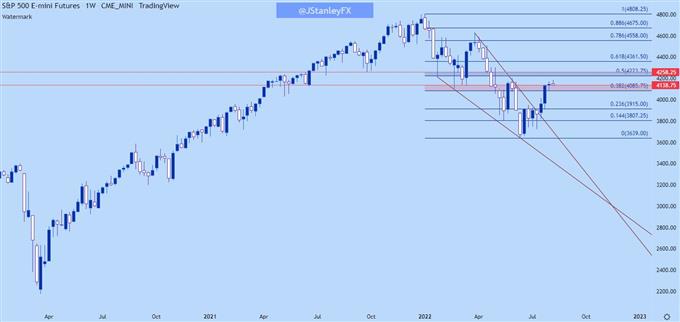
Chart prepared by James Stanley; S&P 500 on Tradingview
S&P 500 futures set a fresh high this morning ahead of the open so bulls are still making a mark here. The bigger question is, again, whether we’re nearing a point where sellers want to take another shot at the bearish trend. The area that I’m following for that this week is 4085, which is the 38.2% Fibonacci retracement of the 2022 sell-off. This also helped to define last week’s low and a breach of that will make the potential for bearish themes look more attractive.
S&P 500 Daily Chart
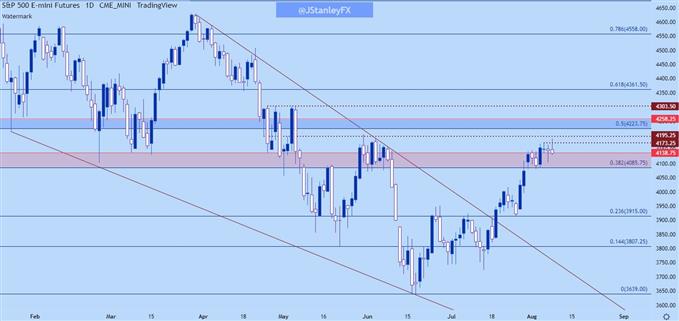
Chart prepared by James Stanley; S&P 500 on Tradingview
Nasdaq 100
The Nasdaq has similar context as above. The index ran into a key trendline last Friday, after which a bearish engulf printed on the daily chart. This morning has seen more follow-through from that, but as I shared earlier this morning, there’s a big zone of support as taken from prior resistance sitting just below current price. Last week’s low of 12,814 could be an important decision point for bearish themes, as a breach of that would also come along with a breach of the bottom of that support zone.
Nasdaq 100 Daily Price Chart
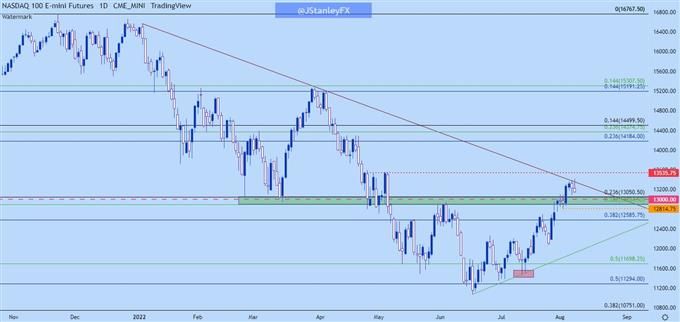
Chart prepared by James Stanley; Nasdaq 100 on Tradingview
--- Written by James Stanley, Senior Strategist, DailyFX.com & Head of DailyFX Education
Contact and follow James on Twitter: @JStanleyFX


