US Dollar Talking Points:
- Next week is busy with a slew of high-impact USD releases to go along with earnings.
- There may be scope for some continued pullback in the bullish USD trend, similar to what I had looked at on Tuesday during the webinar.
- The analysis contained in article relies on price action and chart formations. To learn more about price action or chart patterns, check out our DailyFX Education section.


Many macro themes are intertwined at the moment so this installment of US Dollar Price Action Setups is going to include Gold, Oil and the S&P 500.
The S&P 500 just put the cherry on top of what’s been a strong rip over the past two weeks. Stocks were on their back foot coming into October as a flurry of variables were seemingly going the other way. Inflation was high, the Fed was being pushed towards a taper and then a rate hike, largely in response to that inflation; and oil prices had already started to spike up to fresh seven-year-highs which carried even more potential for higher levels of inflation down-the-road.
But, as we’ve witnessed countless times over the past decade, it’s hard to count stocks out when a Central Bank is supporting the market and today saw the S&P 500 push up to another fresh all-time-high, making for a 5.39% run from the lows of last week and 6.84% for the month of October. This all happened as rates were continuing to rise, making the move all the more impressive and, perhaps even surprising.
For next week the question is whether bulls can continue or whether this poke up to a fresh all-time-high brings some pullback into the mix. We’re heavy into earnings season so that will likely serve some drive, but there’s also a handful of US high-impact data prints on the economic calendar for next week, such as Consumer Confidence on Tuesday or Durable Goods on Wednesday. GDP numbers are released on Thursday and both PCE and Michigan Consumer Sentiment are released on Friday, making for a fairly busy week.
US Data for Next Week
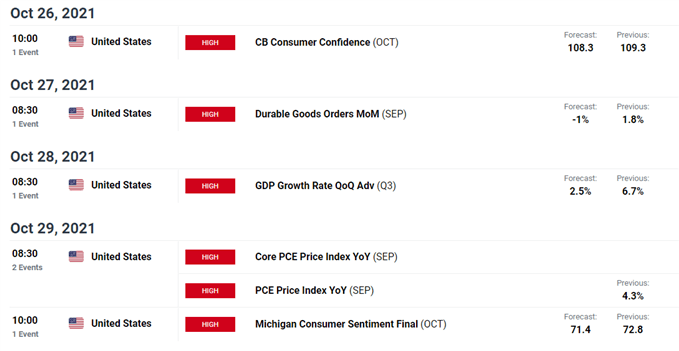
Data derived from DailyFX Economic Calendar
US Dollar
The US Dollar has now spent all of October digesting the gain from late September. But, that late September breakout was significant and driven by proper motive after the Fed signaled the potential for even faster rate hikes than initially expected. And rates markets have continued to run, now pricing in a possible second rate hike for 2022 and as inflation has remained brisk, the yield on US Treasuries have continued to move higher.
The US Dollar has spent the bulk of this week oscillating around support, in the 93.43-93.73 area, which was prior resistance as marked by the Q1 and August swing highs, respectively. With both the fundamental and technical backdrops supporting topside, it would seem that the longer-term bullish trend remains in working order. The bigger complication, however, is the fact that buyers had all week to make a move and they didn’t, which indicates that we may not have seen the low just yet.
Next week’s data will be key but there is an open door for a short-term bearish bias in the USD until the longer-term bullish trend has proper motive for continuation.
US Dollar Daily Price Chart
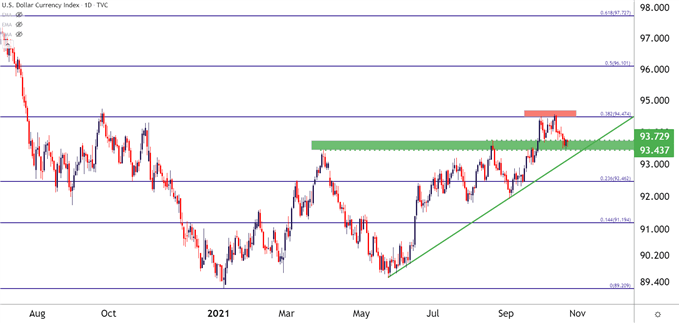
Chart prepared by James Stanley; USD, DXY on Tradingview
EUR/USD Mean Reversion
It was a mean reverting kind of week for EUR/USD. The pair ran into the resistance at 1664 that I had talked about last week, and that stalled the pair for pretty much the entirety of this week with a small range developing with about 50 pips of deviation.
At this point, the range is pretty well worn and given the small distance between support and resistance, may not be all that attractive as a workable theme for next week.
Possibly more attractive, however, is the prospect of using EUR/USD to work with the US dollar and there’s an ECB rate decision on Thursday that could bring some impact here. Beyond current range resistance is another resistance area, plotted around the 1.1700 handle up to the Fibonacci level at 1.1736.
EUR/USD Four-Hour Price Chart
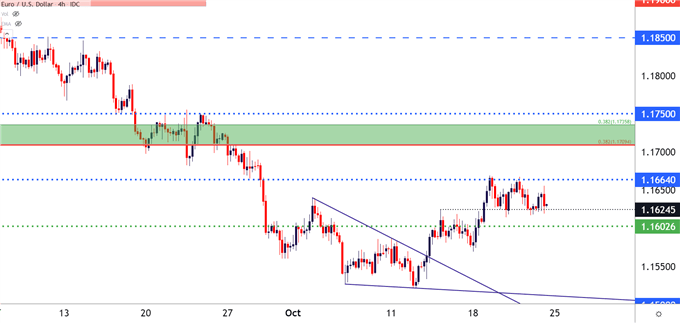
Chart prepared by James Stanley; EURUSD on Tradingview
USD/JPY Snaps Back
The Yen trend finally pulled back. This was probably one of the more pronounced themes to develop out of the September FOMC rate decision, as I had highlighted shortly after that announcement last month. The Japanese Yen continued to show weakness into this week with USD/JPY rushing up to another fresh three-year-high.
I looked into this theme yesterday as the pullback had started, and after bearish engulfing patterns developed in AUD/JPY, Yen strength continued to run through Friday trade.
In USD/JPY, given the pace of the breakout, there’s not much for nearby supports. One possible short-term level appears around 113.17, but it’s that big zone of prior resistance that runs from 111.61-112.50 that looms large as support potential. This zone held the highs in 2019, 2020 and from June until last week’s breakout, 2021. It hasn’t yet been tested for support, however, so this becomes an item of interest for bullish continuation scenarios in the pair if it comes into play.
USD/JPY Weekly Price Chart
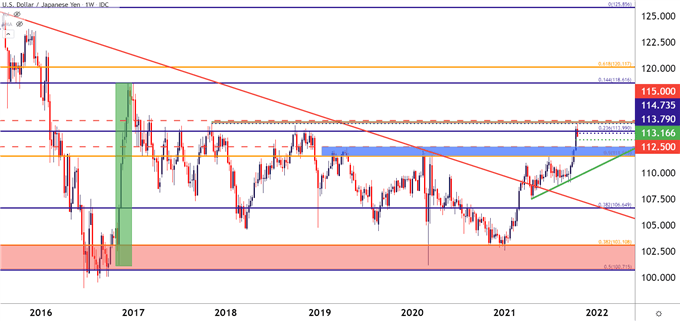
Chart prepared by James Stanley; GBPUSD on Tradingview
S&P 500
Can bulls continue to push up to fresh all-time-high? That’s the big question for next week and with all of the US data on top of earnings, there should be ample motivation for this theme to unveil itself, one way or the other.
Going into the week, there could be some pullback potential, particularly if today’s candle completes as a doji or spinning top after setting that fresh all-time-high. Next support potential appears around the psychological level of 4500, after which a Fibonacci level comes into play at 4476 and another around 4430. On the resistance side, there’s but the all-time-high setting ahead, after which we’ll be breaking fresh ground.
S&P 500 Daily Price Chart
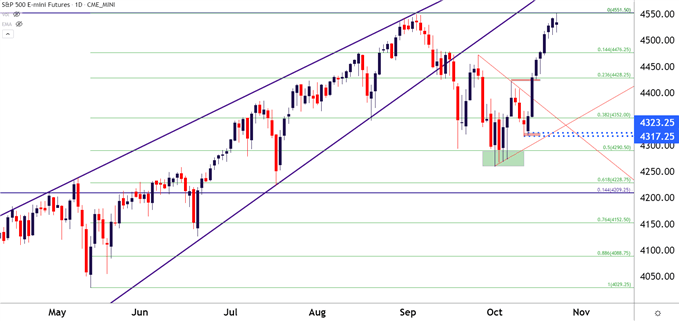
Chart prepared by James Stanley; S&P 500 on Tradingview
Gold
Gold prices have put in a false breakout on Friday and that longer-term bullish trend still remains on hold. That longer-term trend remains in play as a bull flag formation continues to show on the weekly chart.
Gold Daily Price Chart
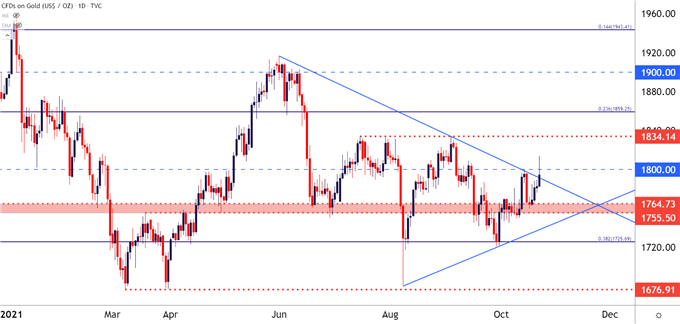
Chart prepared by James Stanley; Gold on Tradingview
Shorter-term, however, is a different story and the recent talk of higher rates out of the Fed has not helped matters much.
Gold can perform well in a stagflation environment, if that is in the cards, but higher rates often are at odds for Gold bulls. Case in point, when Gold prices topped last August, Treasury rates were bottoming before starting to run higher, and as Treasury rates have continued to increase, the pressure has remained on the offer for Gold.
With the potential for USD weakness next week, there remains topside potential for Gold, although traders should be very careful of chasing this higher as we’re still seeing rates increase.
Gold Four-Hour Price Chart
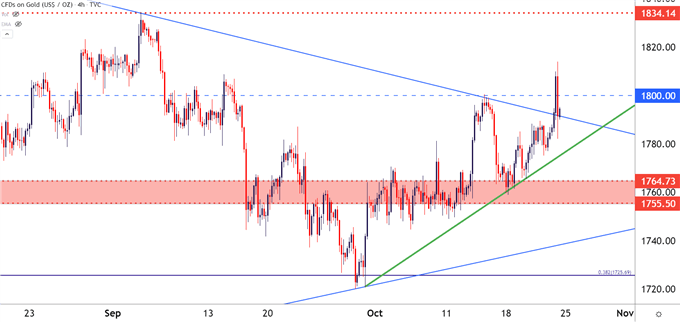
Chart prepared by James Stanley; Gold on Tradingview
Oil Runs into a Big Level
Oil prices have been running aggressively higher for two months now after setting a low on August 23rd. This has shown as crude oil has broken through multiple resistance zones, most recently the zone around the 75-handle from which the prior six-year-high had held.
There may be scope for some pullback here as another new resistance level has come into play, and RSI has begun to diverge on the four-hour chart. Also, notably, the resistance zone that ran from 75-76.72 has seen one quick support test right after the breakout but not much since. This could be an opportune environment for that pullback to check support at prior resistance.
The new resistance level coming into the equation is the 50% marker of the 2001-2008 major move in oil.
Crude Oil Monthly Price Chart (CL2)
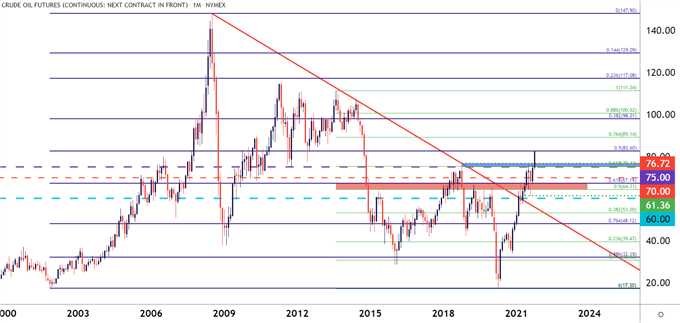
Chart prepared by James Stanley; CL2 on Tradingview
--- Written by James Stanley, Senior Strategist for DailyFX.com
Contact and follow James on Twitter: @JStanleyFX


