


US Dollar, EUR/USD, GBP/USD, USD/CAD, AUD/USD Talking Points:
- The US Dollar is holding support after last week’s Powell-induced pullback.
- This week brings a few high-impact USD releases but, NFP on Friday is likely going to be the big driver as this is the last such report that the FOMC will see ahead of the September rate decision.
- The analysis contained in article relies on price action and chart formations. To learn more about price action or chart patterns, check out our DailyFX Education section.

The focus is squarely on this Friday’s Non-farm Payrolls for indication of just how quickly the Fed might be looking to start tapering asset purchases. As Jerome Powell said last Friday, the economy has met the marker for ‘significant further progress’ in terms of inflation; but in terms of employment, the economy isn’t quite there yet according to the head of the FOMC, and this puts even more focus on jobs numbers.
This Friday’s NFP report is the last such report that the Fed will get to see before the September rate decision, which is a quarterly rate decision as the bank will also be furnishing updated guidance and projections. The wide thought is that if the bank is, in fact, looking to taper asset purchases by the end of 2021, that September rate decision will likely be important for the FOMC telling us when and how they’re planning on doing it.
If Friday’s jobs report falls flat, there’s even more motive for the Fed to stay loose and passive, kicking the can on taper into 2022 and this could lead to some aggressive USD-weakness.
To learn more about Non-farm Payrolls, check out DailyFX Education
At this point, the US Dollar is holding on to a short-term bearish trend while the longer-term trend does retain some element of bullishness, looking back to the June/July lows that remain about 3% away.
The current USD setup is showing resistance at a prior spot of support, taken from around 92.80-92.90. A bit lower is another big spot of resistance and this is the same spot that caught the mid-August swing-low, and that’s around 92.45 with a couple of different Fibonacci levels.
To learn more about Fibonacci, check out DailyFX Education
US Dollar Four-Hour Price Chart
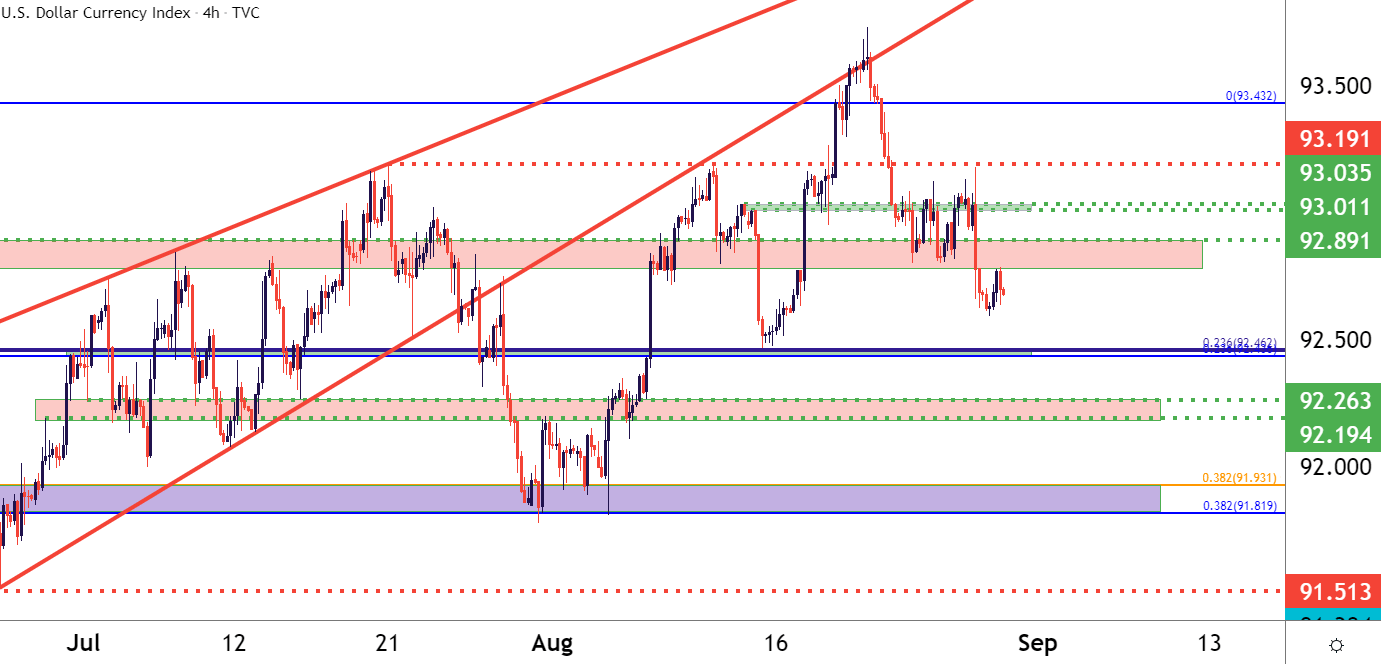
Chart prepared by James Stanley; USD, DXY on Tradingview
EUR/USD Fresh Three-Week-High
As the US Dollar sold off last week on the back of Powell’s comments, EUR/USD pushed up to a fresh three-week-high, finding resistance at a familiar spot on the chart around the 1.1800 level. A shallow pullback to start this week was met with support at prior resistance, taken from around 1.1780, with buyers pushing price action right back into the resistance zone.
This keeps the door open for bullish short-term themes, targeting the 1.1856 area, which has few different support/resistance items in rather tight proximity.
EUR/USD Four-Hour Price Chart
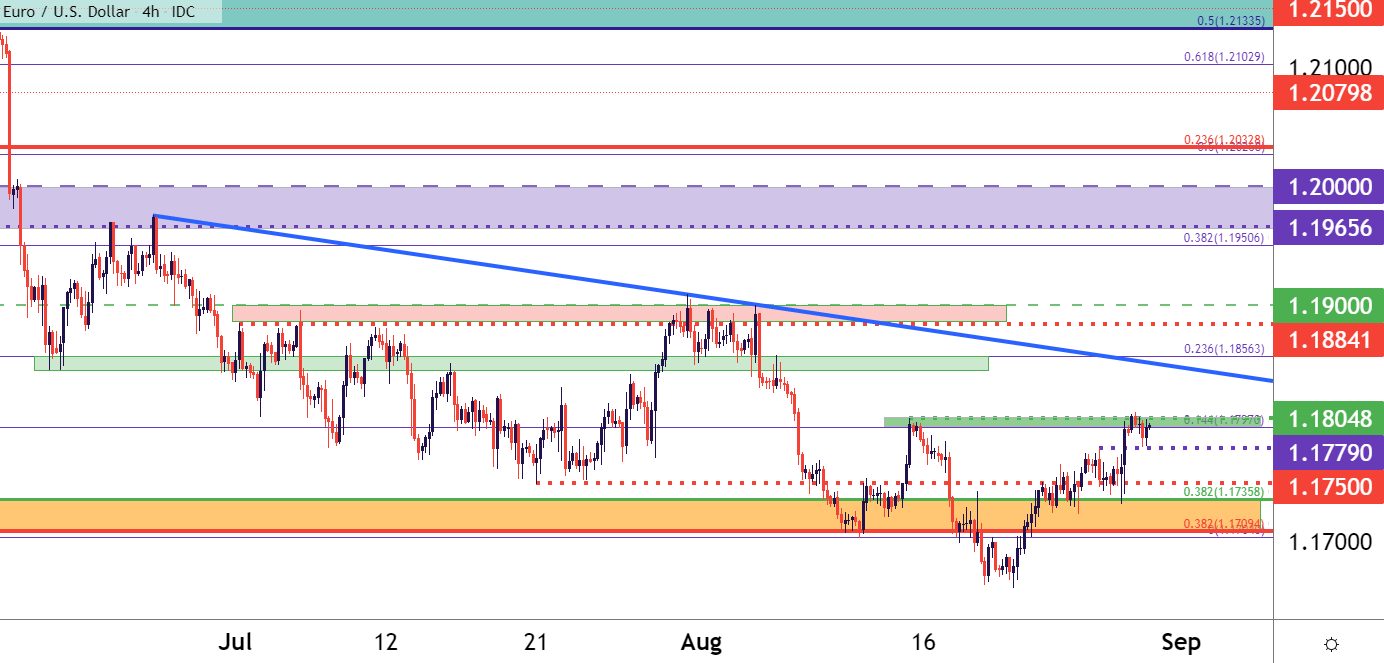
Chart prepared by James Stanley; EURUSD on Tradingview
GBP/USD Support Catches at Fibonacci Zone
I had looked at this one last week ahead of the late-week fireworks, and the jist was trying to catch higher-low support for bullish drives. The zone that I was following spans between two confluent Fibonacci levels running from 1.3649-1.3678; the latter of which came into play on Thursday, helping to set the low in the pair.
As USD weakness filtered into GBP/USD around Powell’s Friday comments, the pair pushed up to a fresh weekly high but was unable to put in much distance beyond the 1.3768 level. This level stands as resistance in the early part of this week, and horizontal resistance combined with the higher-lows, which gives the appearance of an ascending triangle over the past week keeps the door open for bullish breakout potential in the pair.
To learn more about the ascending triangle, check out DailyFX Education
GBP/USD Four-Hour Price Chart

Chart prepared by James Stanley; GBPUSD on Tradingview
USD/CAD Holding Support at a Big Spot
I’ve just published an article to take a deeper look into USD/CAD, and last week’s fireworks helped to push prices in the pair back to a key spot of support.
There was a quick touch down to a fresh weekly low to start this week, so there may be some brewing bearish potential; but at this point, USD/CAD is holding above a trendline that originates off of the June lows, while also holding in a big spot on the chart that spans from the psychological level of 1.2500 up to a Fibonacci zone from 1.2621-1.2632.
To learn more about trendlines or psychological levels, please check out DailyFX Education
USD/CAD Eight-Hour Price Chart
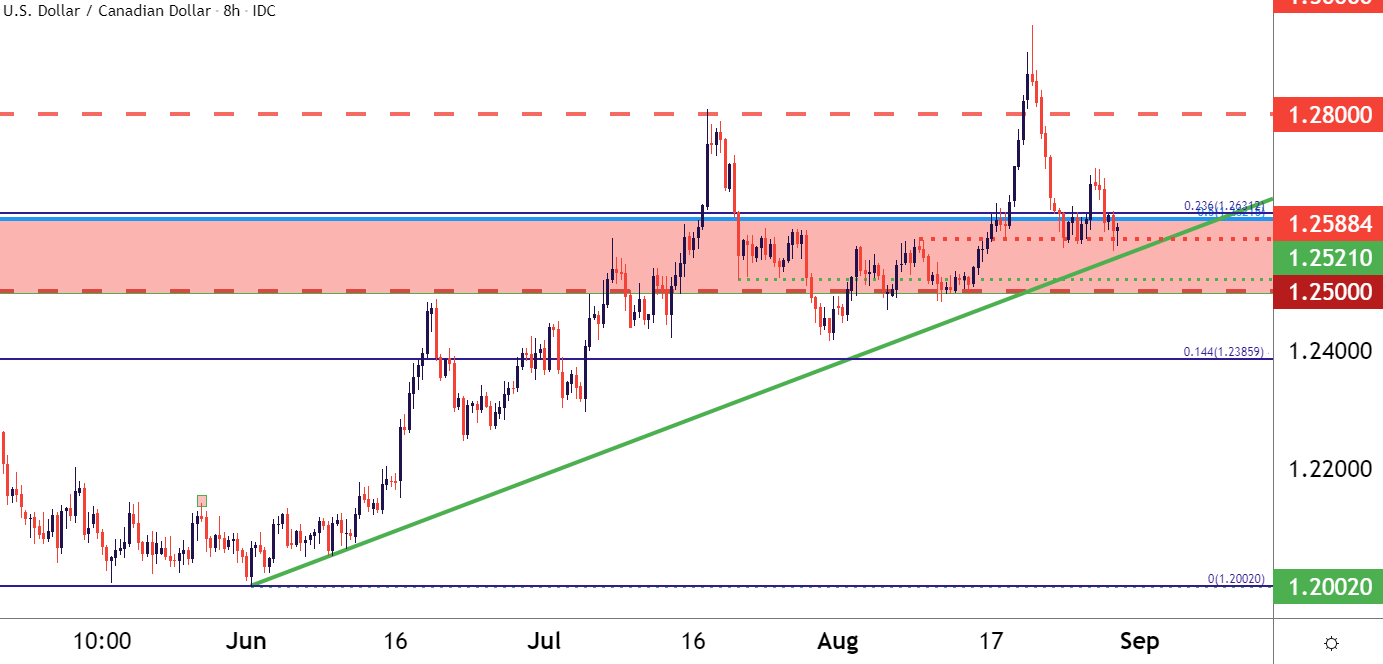
Chart prepared by James Stanley; USDCAD on Tradingview
AUD/USD Recovers from Spill
On the long side of the US Dollar, AUD/USD remains a potential option. When USD-strength was raging in mid-August, AUD/USD was falling aggressively. The pair did pull up before testing the .7000 psychological level, and prices have snapped back aggressively since then.
At this point, AUD/USD is catching resistance at a confluent spot on the chart, taken from a batch of prior swing-lows. This runs from around .7290-.7317. But something to consider on the short-side of the pair at the moment is the bearish trendline that connects July and mid-August swing highs. There was a temporary breach of that level last Friday but prices have since sunk back-below. So for short-term strategies looking at a reversal of last week’s move, defense of this resistance will be key.
AUD/USD Four-Hour Price Chart

Chart prepared by James Stanley; AUDUSD on Tradingview
--- Written by James Stanley, Senior Strategist for DailyFX.com
Contact and follow James on Twitter: @JStanleyFX


